

Deploying a k8s fleet without existing collectors
A guided walkthrough to configure a Kubernetes cluster running test fixtures, Grafana, and an OpenTelemetry agent collector managed in telflo.
In this walkthrough we'll deploy an OpenTelemetry collector into a Kubernetes cluster using telflo. All you need is a test machine; we'll be using an Ubuntu Linux 24.04.3 Server VM, but any machine should work. When we're finished you'll have a running MiniKube k8s cluster with test fixtures sending mock data to a local Grafana instance through an OpenTelemetry collector agent! Sounds fun, right? Let's get started.
Before you begin
- A VM with at least 4 processors and 10768 of memory.
- A Telflo account. Sign in at telflo.com.
Initial Architecture
A quick word on the setup. In the first part of this tutorial we're going to configure a MiniKube cluster that has two test fixtures sending telemetry data (Traces and Logs) to a collector address, but no collector will initially exist (that's what this tutorial is for). A lot of these steps will be automated so that we can focus on collector management, however you can think of this as part of an OpenTelemetry implementation in which you have previously instrumented applications to send to an OpenTelemetry receiver. We'll also set up a Grafana instance so that when the data is received we can view it. High level, the initial setup will look like this.
Now with that in mind, let's get set up.
Step 1: Install the Dependencies
First we need to install the tools necessary to run the cluster which includes Docker, MiniKube, Helm, and kubectl.
-
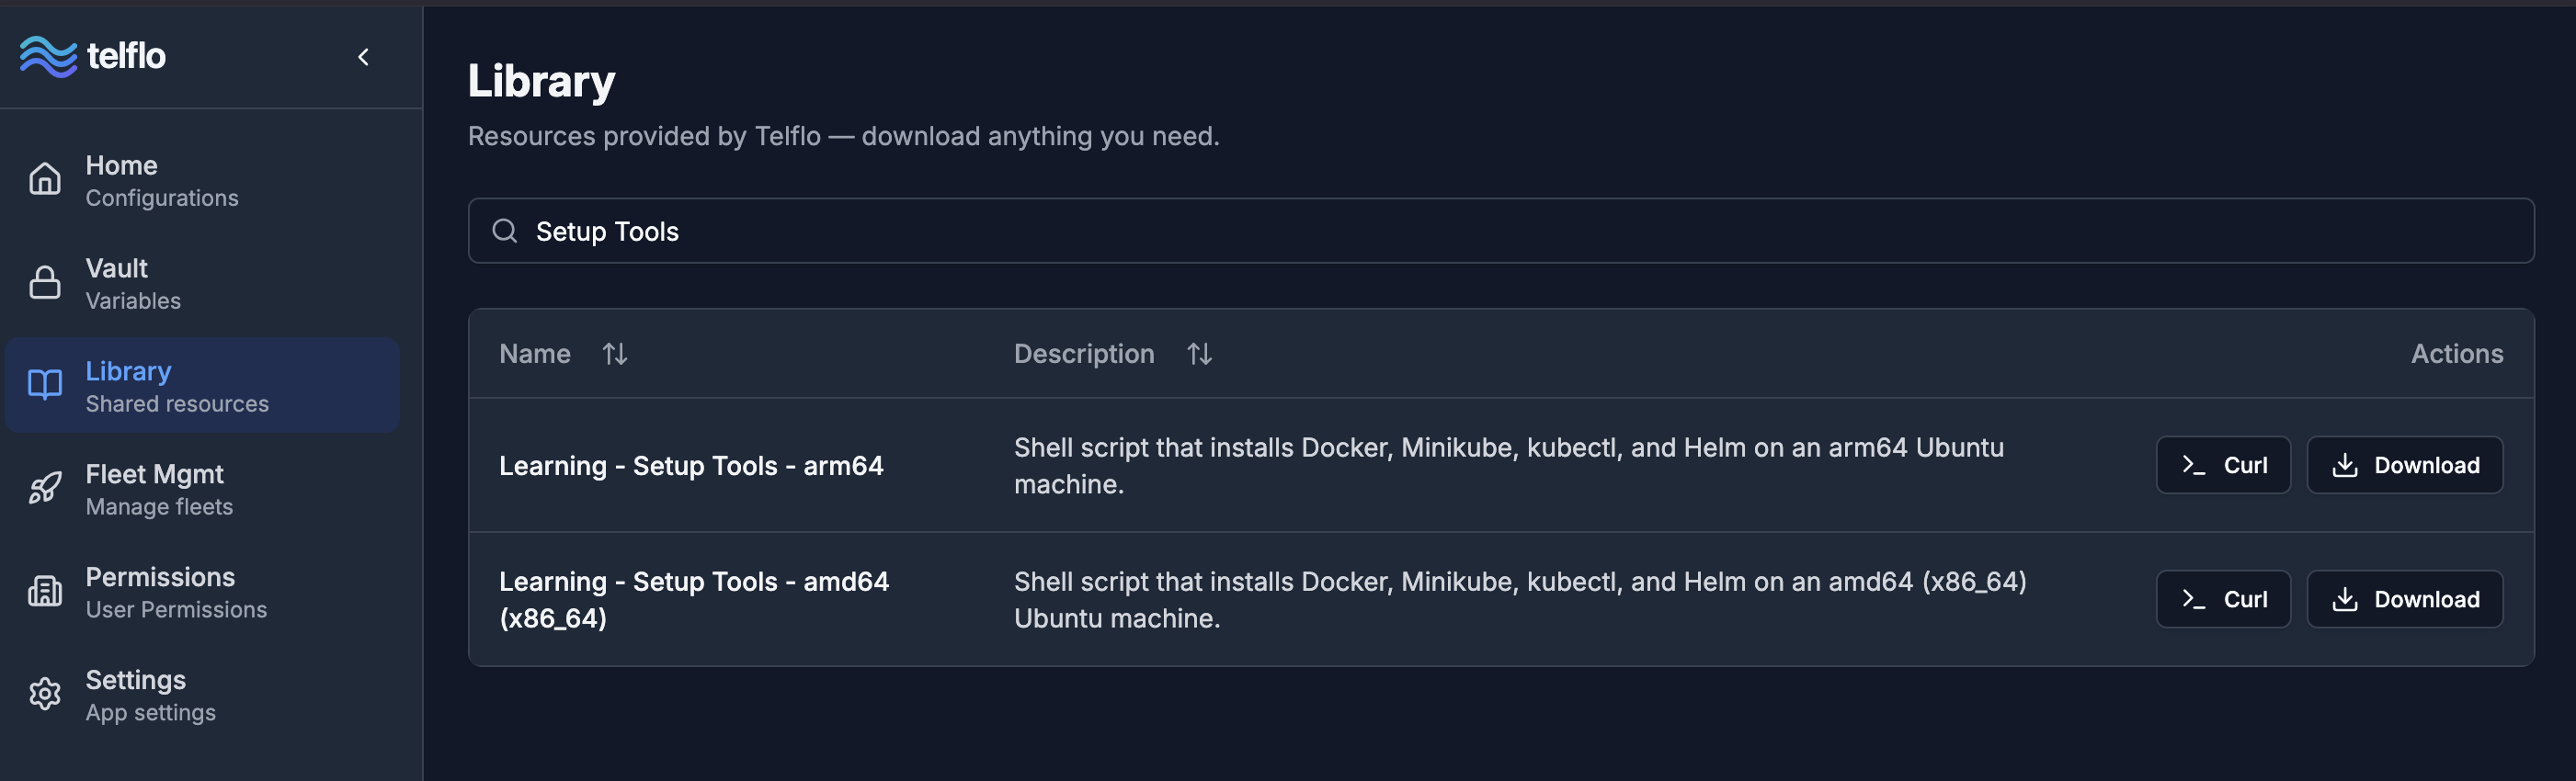
Within telflo, click on the Library menu item on the left of the page and in the search bar type "Setup Tools". This should reveal two "Learning - Setup Tools" options. Find the one that matches your processor architecture and click the ">_ Curl" button. This will copy a Curl command to your clipboard.
-
Now ssh into your VM, paste the command that was copied to your clipboard, and hit enter. This will download a shell script to your root directory. The shell script contains all of the commands to download and install the dependencies.
-
In this tutorial we'll run the script, but if you don't want to run the script you can open it in an editor and execute the commands line by line. In order to run the script, we must make the shell script executable with the following command.
chmod +x install-cluster-tools-arm64.shNote: The file name may differ, update as needed.
-
Run the command to install all of the dependencies.
./install-cluster-tools-arm64.sh
Step 2: Deploy the cluster
With all of the tools installed, we can set up the cluster to resemble the diagram above.
-
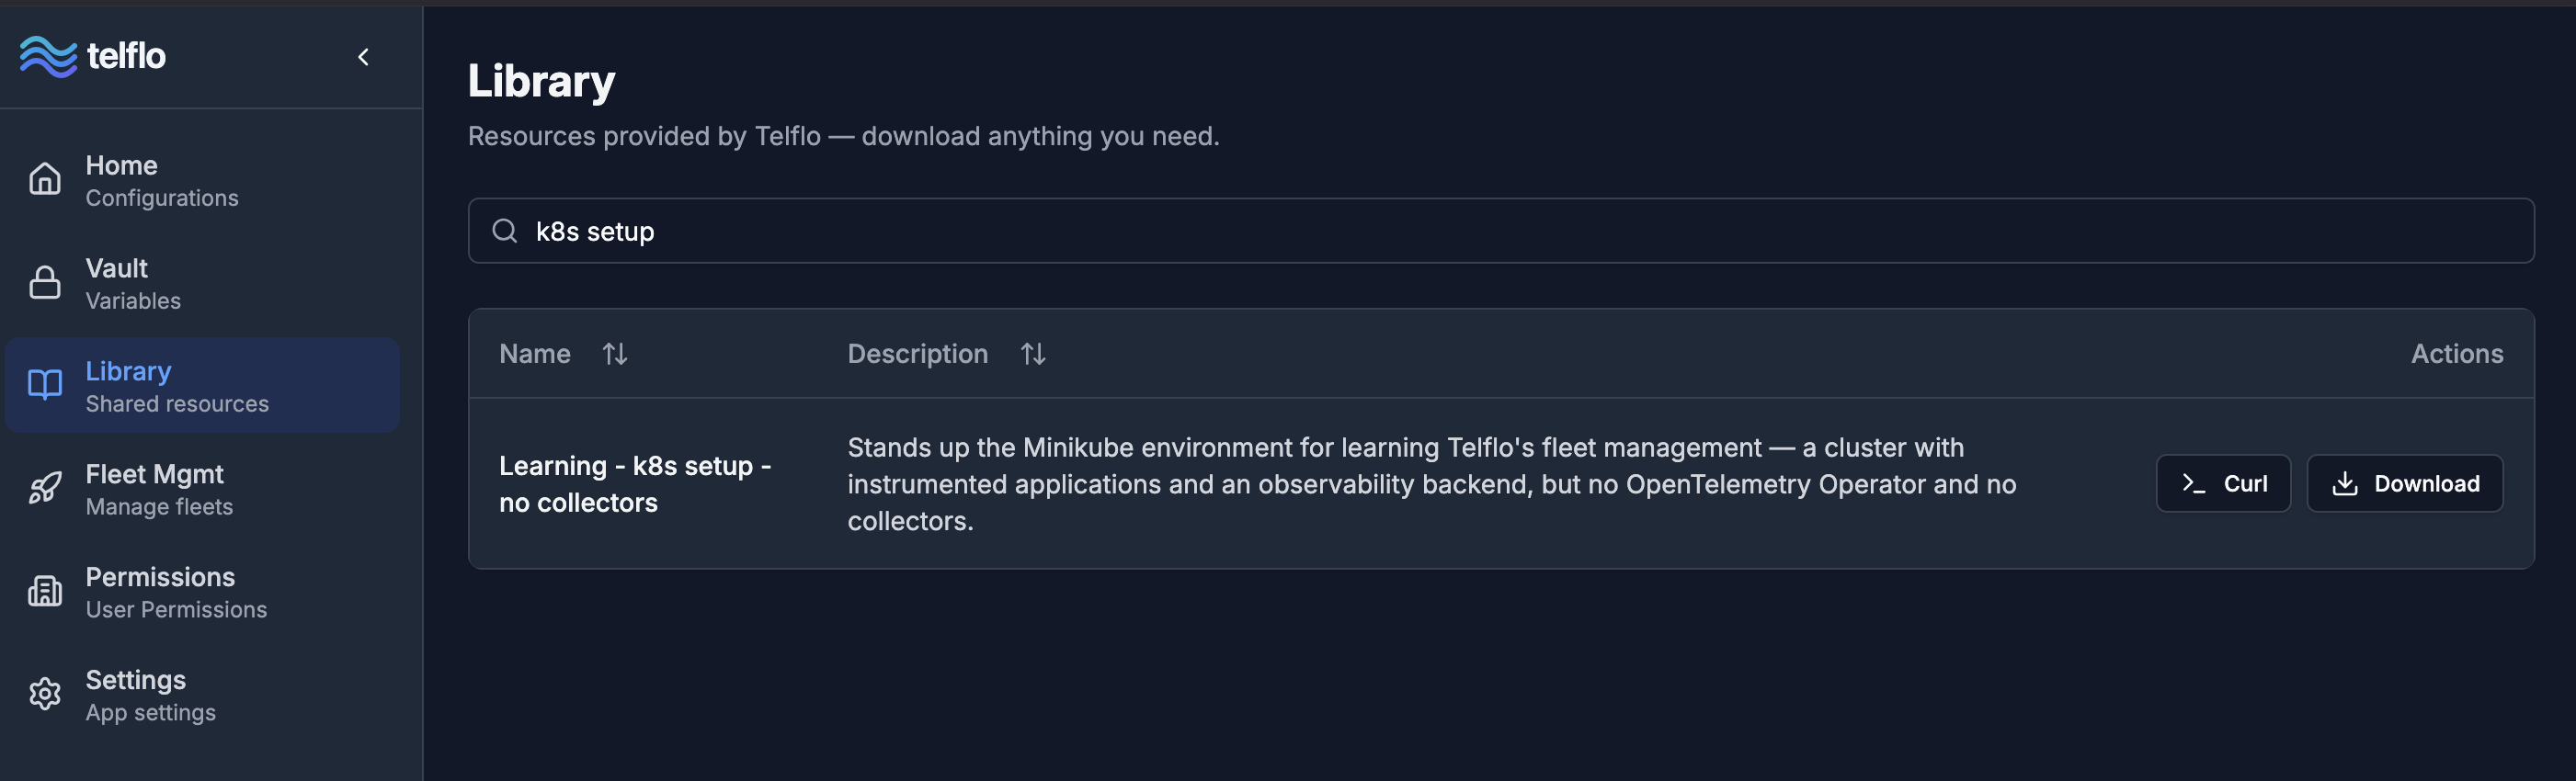
Return to the Library in telflo, and search for "k8s setup". Locate the "Learning - k8s setup - no collectors" record and click the ">_ Curl" button. This will copy a Curl command to your clipboard.
-
Return to your ssh session and paste the Curl command. Hit enter to download the bundled helm charts that will be used to deploy the test cluster.
-
Extract the packaged file.
tar -xvf k8s-learning-no-collectors.tar.gz -
With the package extracted, cd to the helm subfolder
cd k8s-learning-no-collectors/helm -
Finally, execute the deploy script
./deploy.sh
Wait for the script to finish. This might take some time, but when it's done you should have a MiniKube cluster running in your VM with test fixtures sending OTLP telemetry data, and a Grafana instance ready for telemetry monitoring. You can verify the status of your cluster by running
kubectl get pods -AThe result should look something like this:
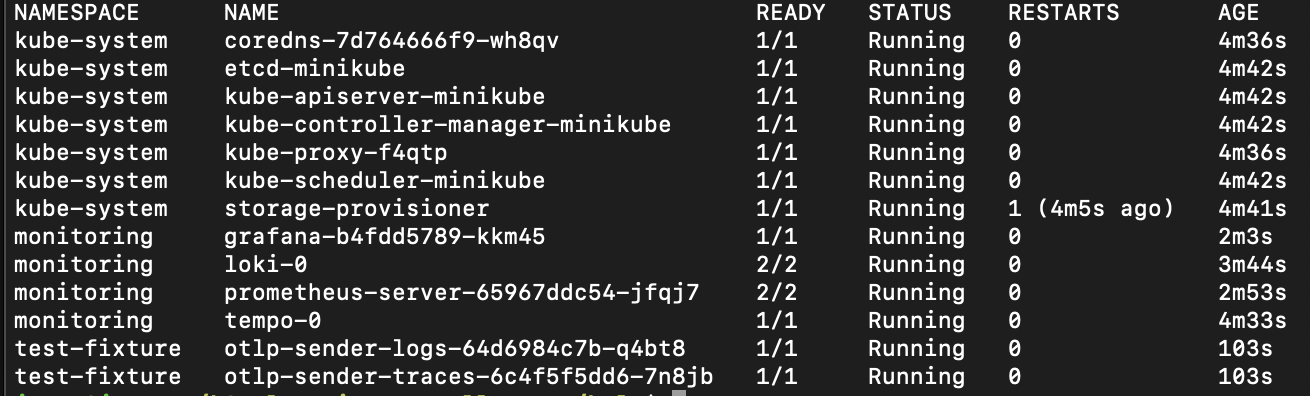
Notice we've grouped all of the functionally similar components into their own namespaces. For instance, "kube-system" is where all of the k8s components live, "monitoring" is where Grafana components live, while both test fixtures live in a "test-fixtures" namespace; this is arbitrary and just our choice to keep things clean. What is important however, is the (unlisted) namespace that the test-fixtures send data to. The fixtures send mock OTLP data to the FQDN of the (soon to exist) agent collector. The exact FQDN is formed as
http://[collector-name]-collector.[namespace].svc.cluster.local:4318
This will be important in just a bit, just remember that the collector-name and namespace are used to form the FQDN that the test fixtures send mock data to.
Step 3: Open Grafana
We want to open Grafana in a browser on our local machine (not the VM since it's a server) in order to view the data being stored in the backend (Loki and Tempo), but it's running in a cluster in a VM. Fortunately, it's not difficult with some port mapping and can be accomplished in 1 step. Open a new command window and run the following, replacing VM_LOGIN with your VM login name, and VM_IP with the IP of the VM.
ssh -L 3000:localhost:3000 <VM_LOGIN>@<VM_IP> 'kubectl port-forward -n monitoring svc/grafana 3000:80'After providing your password and hitting enter, open a browser and navigate to http://localhost:3000 and Grafana should appear. Log in with user/password as admin/admin and navigate to the "Drilldown" --> "Logs" view. You should see no logs present, which makes sense. The apps are sending data, but we haven't implemented a collector to move the data into the data stores yet. BUT, we're 1 step closer.
Step 4: Create a Configuration
When we create a collector, we'll need to assign it a configuration so that it knows where to send the data to; so before we implement fleet management let's create a configuration.
-
In telflo, click on the "Home" menu item in the left.

-
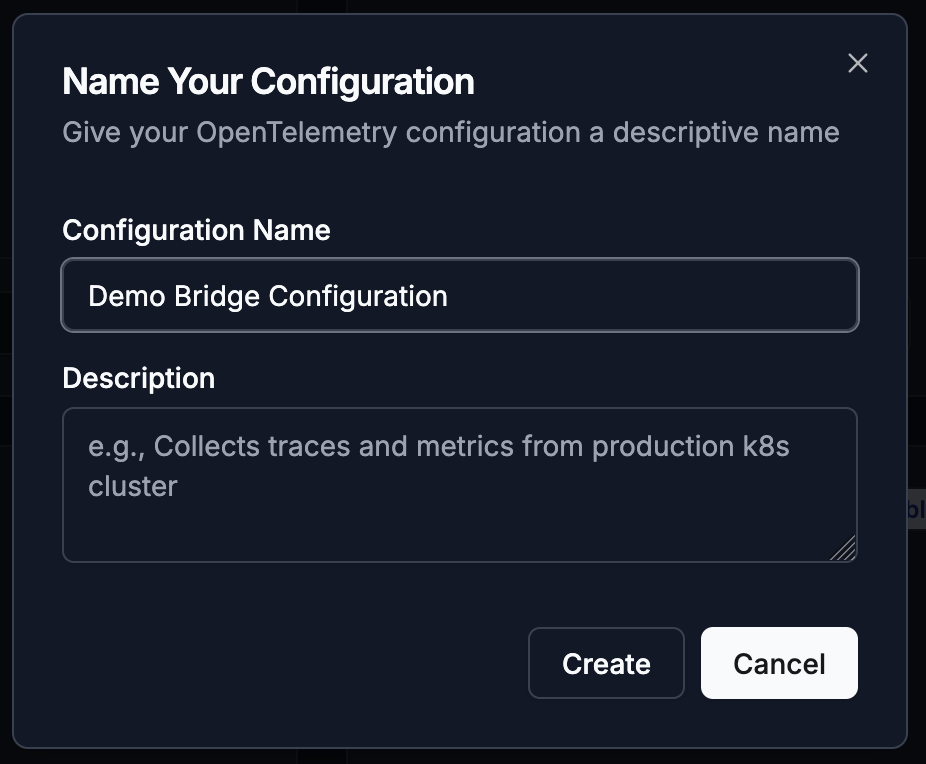
Click the "+ New Configuration" button and provide a name for the configuration; we'll name ours "Demo Bridge Configuration". Click "Create".
-
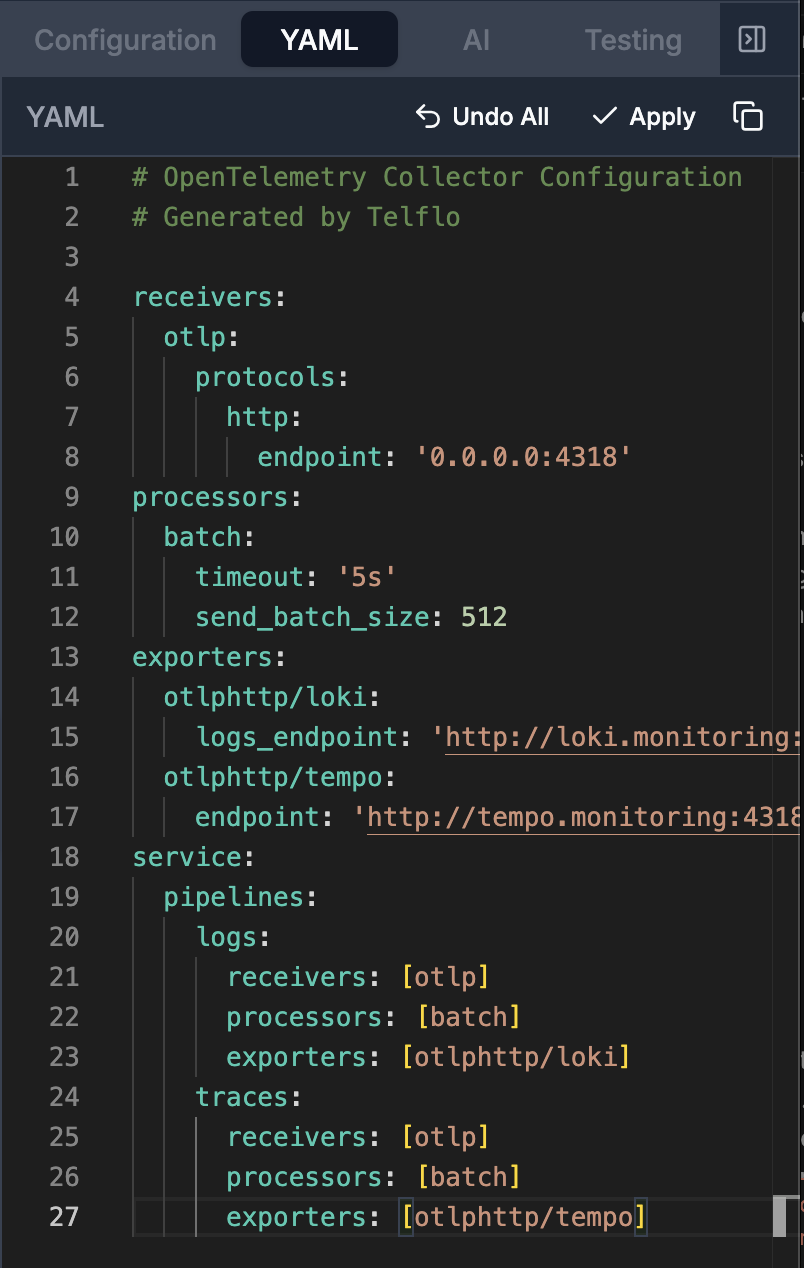
Once the configuration is created, you will be routed to the editor page. Here you will define the YAML that the collector will use as its configuration. The editor page has many features that will assist you in the creation and management of your collectors but for this demo we'll edit the YAML directly. First, copy the following configuration YAML.
Next, click the YAML tab on the right side of the editor and paste the copied YAML. Finally, click the "Apply" button.
The visual editor should update and you should see your configuration.
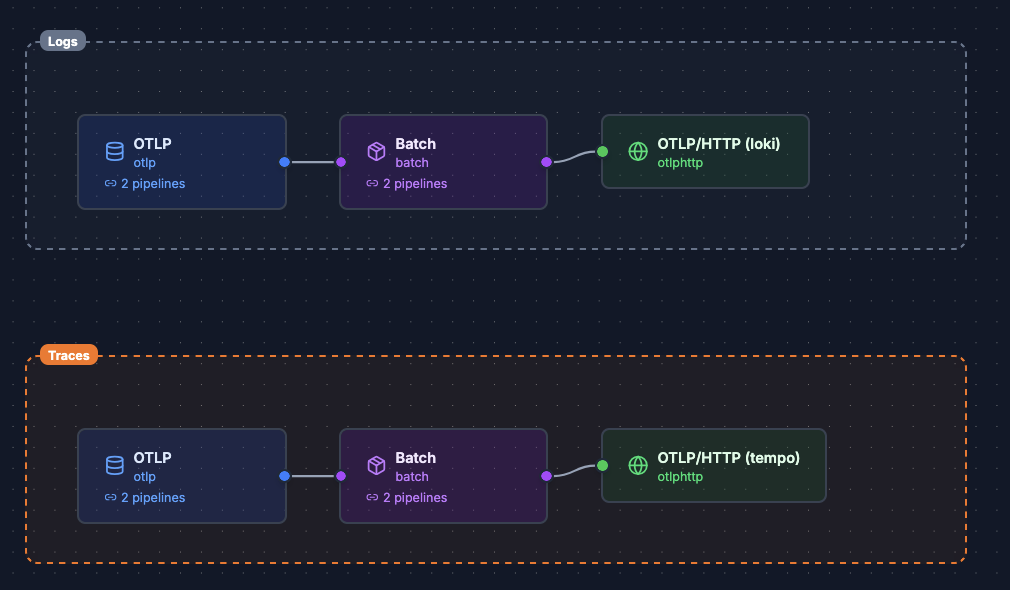
Take a moment to notice the "otlphttp/loki"."logs_endpoint" and the "otlphttp/tempo"."endpoint" properties in the YAML. You'll see that they use the FQDN format defined above, and they use the same "monitoring" namespace displayed when we viewed the pods in step 2. Also, remember that the test fixtures will be sending data to the "ns-col" namespace.
-
With the configuration done, we need to publish it. Click the "Version" dropdown and click the "Publish to Organization" button. Save if prompted.
 Now that the configuration is published and ready for deployment,
return to the "Bridge Demo", let's create the Fleet!
Now that the configuration is published and ready for deployment,
return to the "Bridge Demo", let's create the Fleet!
Step 5: Create the Fleet
Before we begin it's important to understand what role the OpenTelemetry Bridge and Operator play in this solution. The k8s Bridge acts as an intermediary component that implements the OpAMP client protocol, receives responses from an OpAMP server (in this case telflo), and manages the CR collector definitions within the cluster based on the responses. Effectively, it manages the deployed CR definitions based on server responses. The Operator component watches for CR changes and updates the deployed k8s components to match the CR list. With those two working in tandem, we have a solution to manage a k8s OpenTelemetry collector fleet: The bridge updates CRs, and the Operator syncs the cluster to the CRs.
Now let's deploy a collector within the fleet.
-
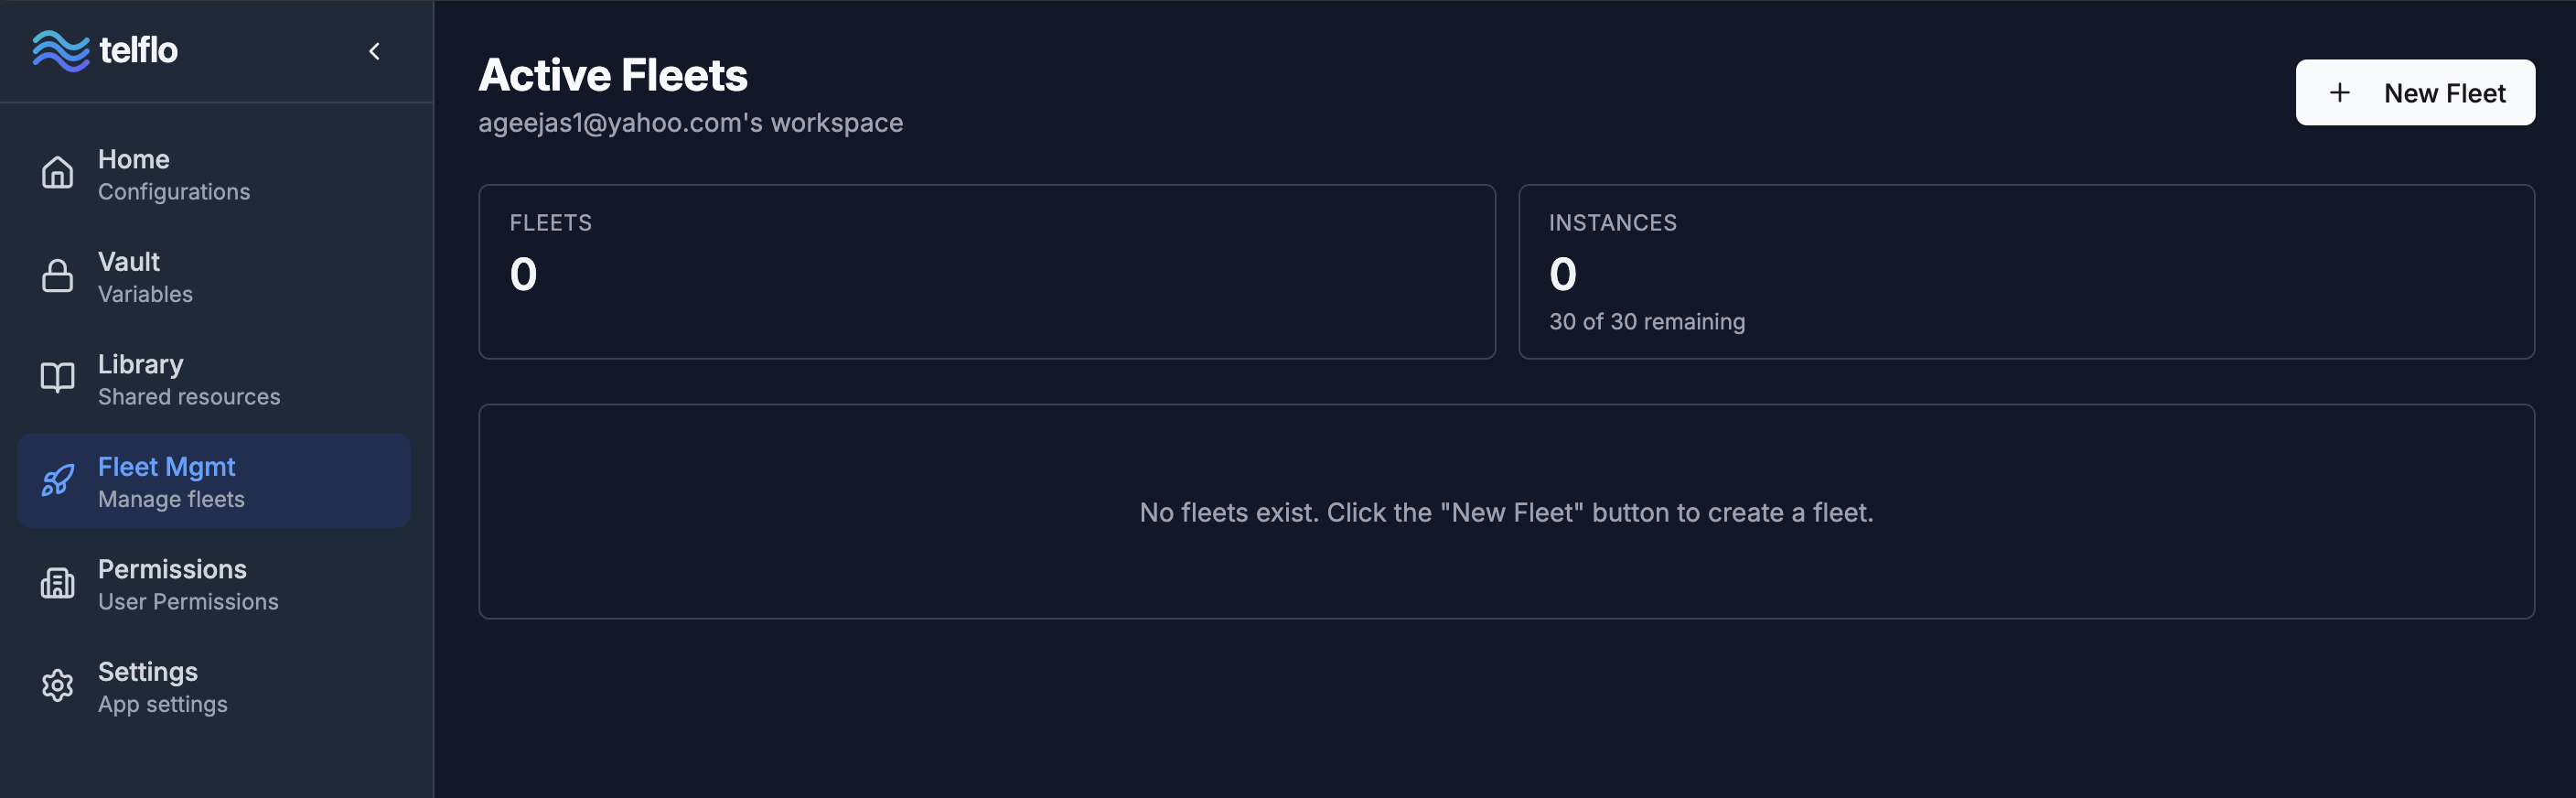
In the left menu bar, click on "Fleet Management". You should see the "Active Fleets" page, and in the top right corner a "+ New Fleet" button. Click it.
-
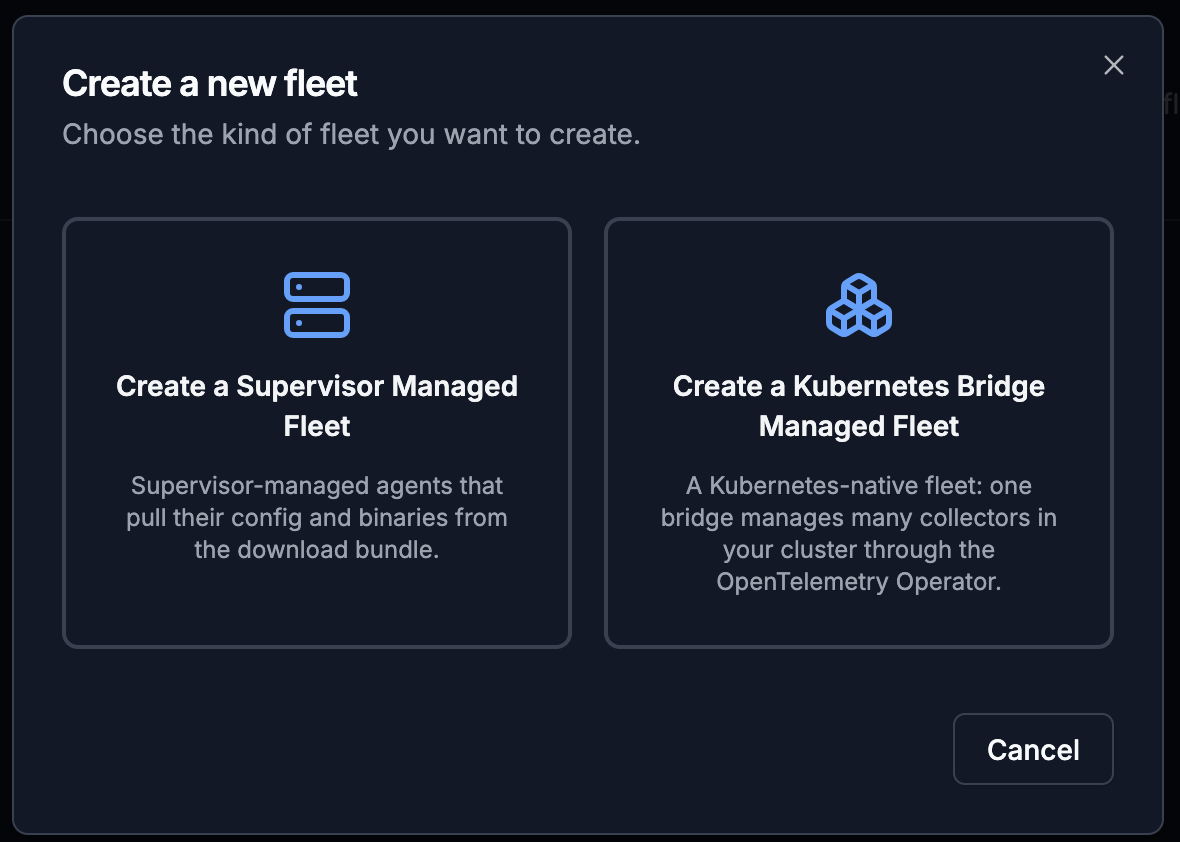
There are two OpAMP clients that provide fleet management support: Supervisor and Bridge. While telflo supports both options, this tutorial addresses the "Bridge" option, so when the popup opens asking you to choose the deployment type, choose the "Create a Kubernetes Bridge Managed Fleet" option.
-
In the next dialog, provide a name for your fleet. We'll call ours Bridge Demo.
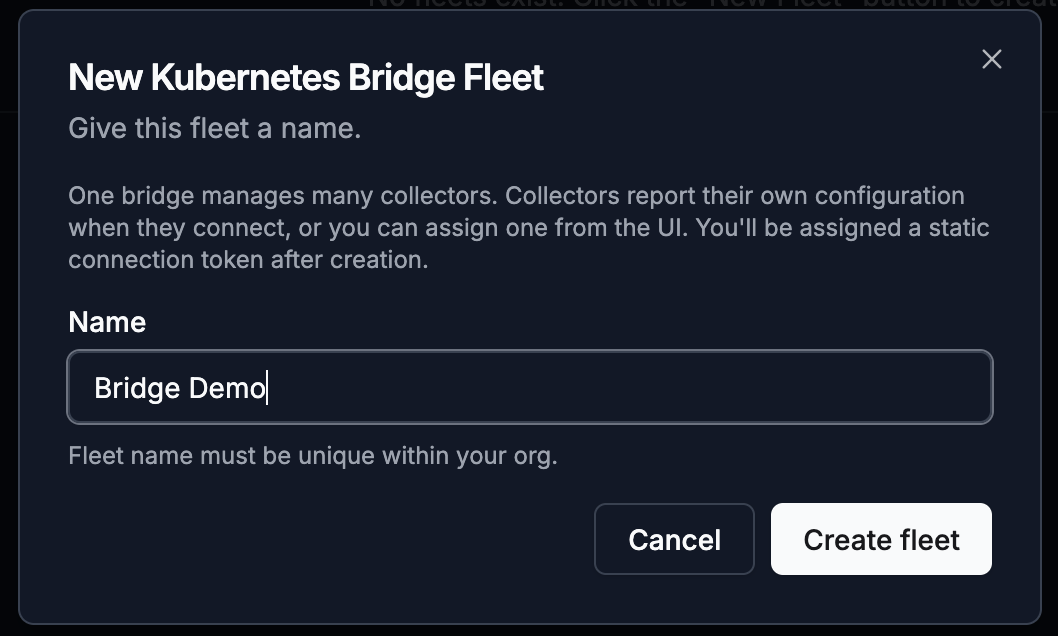
-
Click the "Create fleet" button, and then click "Done".
-
The new fleet should appear in the table. Click the "Bridge Demo" fleet name to enter the fleet management page.
-
You should now be in the "Bridge Demo" fleet management page. This is the page where you will manage your fleet including the collectors within the fleet.
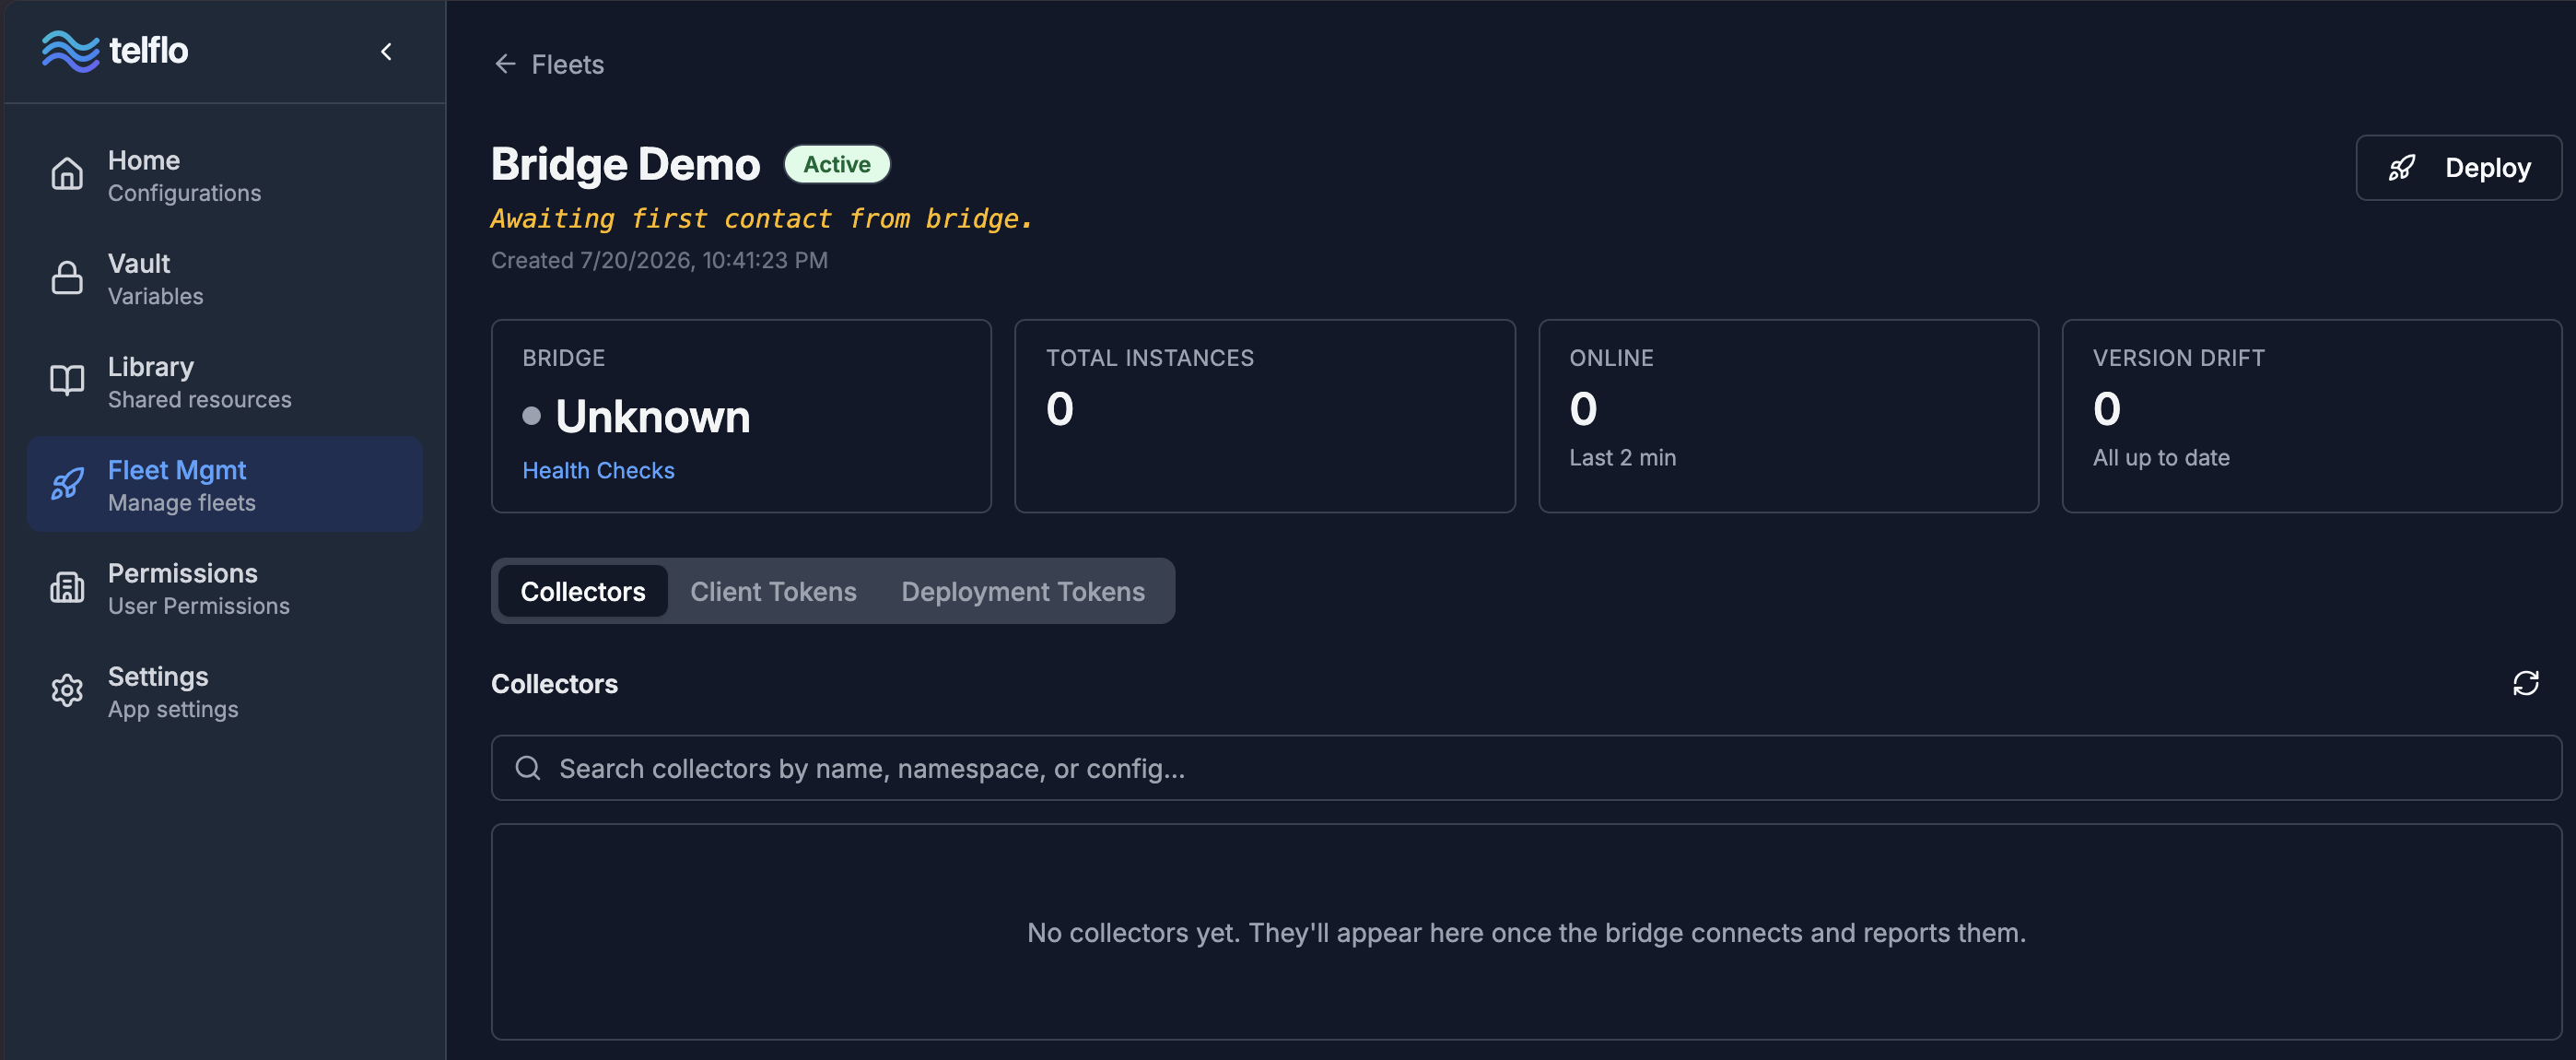
The first thing to notice about this page is the "Awaiting first contact from bridge" message. That message tells us that, although the fleet has been defined it has not been deployed to your environment and a bridge has not made contact to telflo yet. As discussed above the Bridge connects to an OpAMP Server (in this case telflo) to receive the CRs that it will manage and in this case, no Bridge has made contact. Let's fix that by deploying a bridge.
Step 6: Deploy the Operator and Bridge
-
Click on the "Deploy" button to open the "Deploy Telflo Bridge" dialog. In this example we have no existing collectors so select the "I have no collectors yet." The alternative "I have existing collectors" is very similar, it just provides a couple of extra steps to label the existing collectors in your cluster, but in this example that's unnecessary.
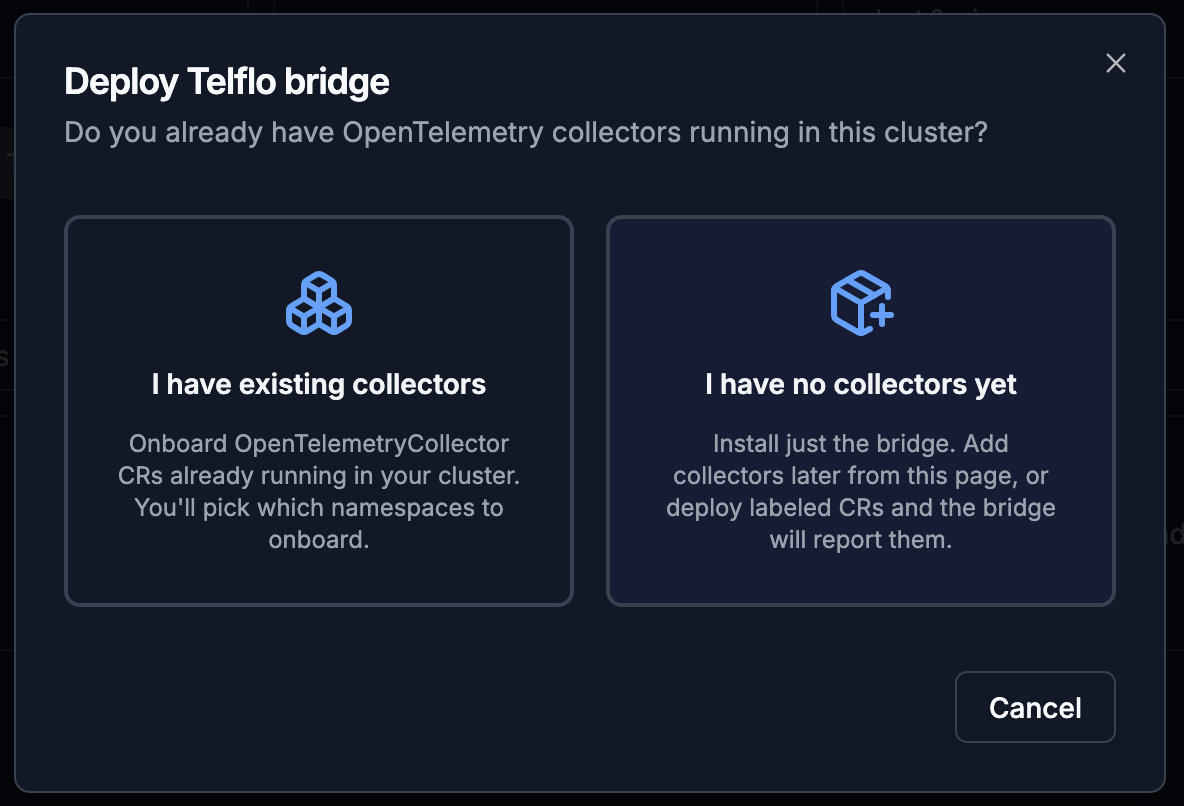
-
After clicking the "I have no collectors yet" button, you'll be presented with the option to include the Operator in your deployment. If you already had an Operator managing the CRs in your cluster you would leave this unchecked, but in this demo we do not so let's check the "Include operator installer" option and then click "View steps".
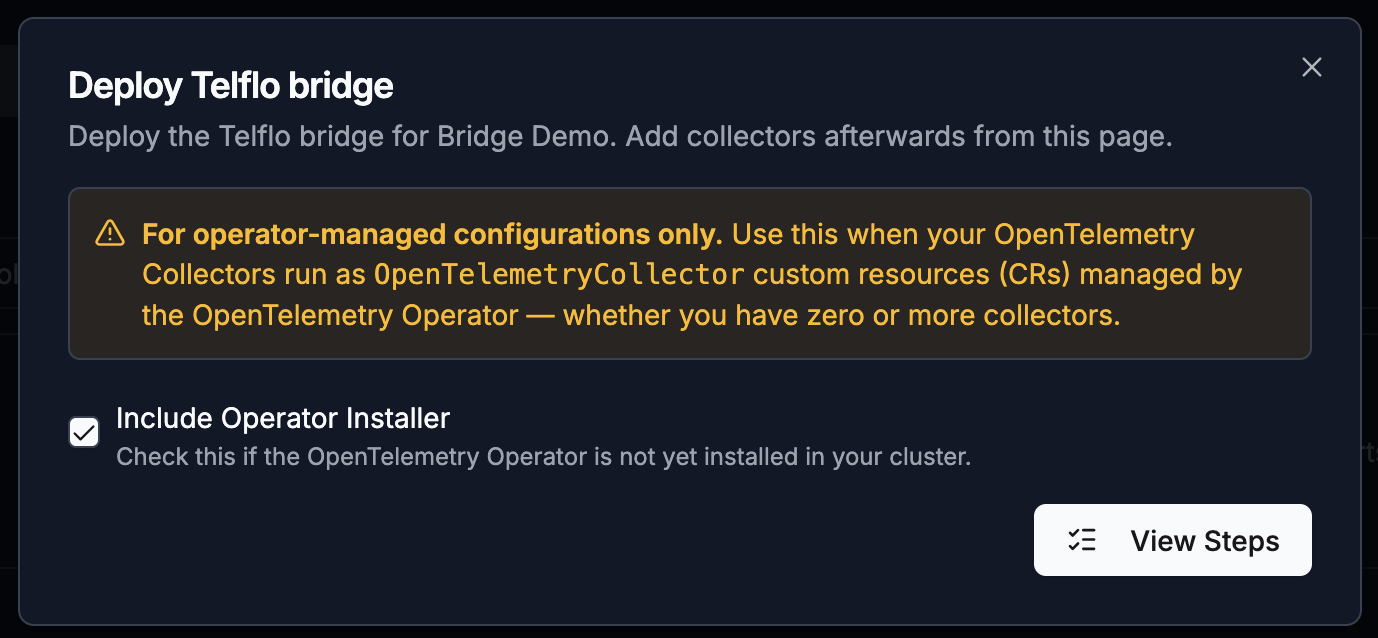
-
When you view the steps, you're presented with the "Deploy steps - Bridge Demo" dialog. This contains all of the steps to deploy the operator and bridge into your environment. Let's go step by step.
To begin, copy the Operator install instructions.
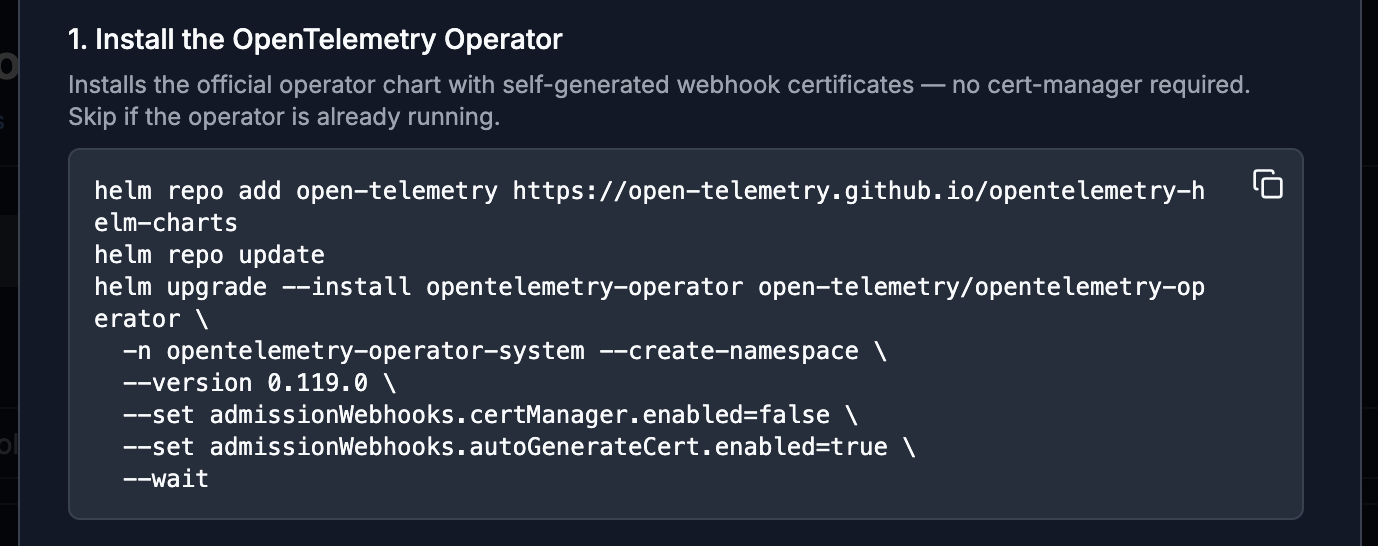
Then paste the script in your ssh command and press enter. This will install the Operator component into your cluster. When it's finished run
kubectl get pods -n opentelemetry-operator-systemYou should see the Operator listed and available in your cluster.

Repeat the same steps for the "Install the telflo bridge" instructions. When you are finished close the dialog to return to the Bridge Demo page and wait, or if you're like me hit refresh repeatedly until something changes :)
Note: The bridge install command contains the fleet's bearer token — it is masked on screen, but copying puts the real token on your clipboard. Paste it into a secure shell — not shared logs or chat.
What you should see is that the "Awaiting first contact" text should disappear and the Bridge should show as connected.
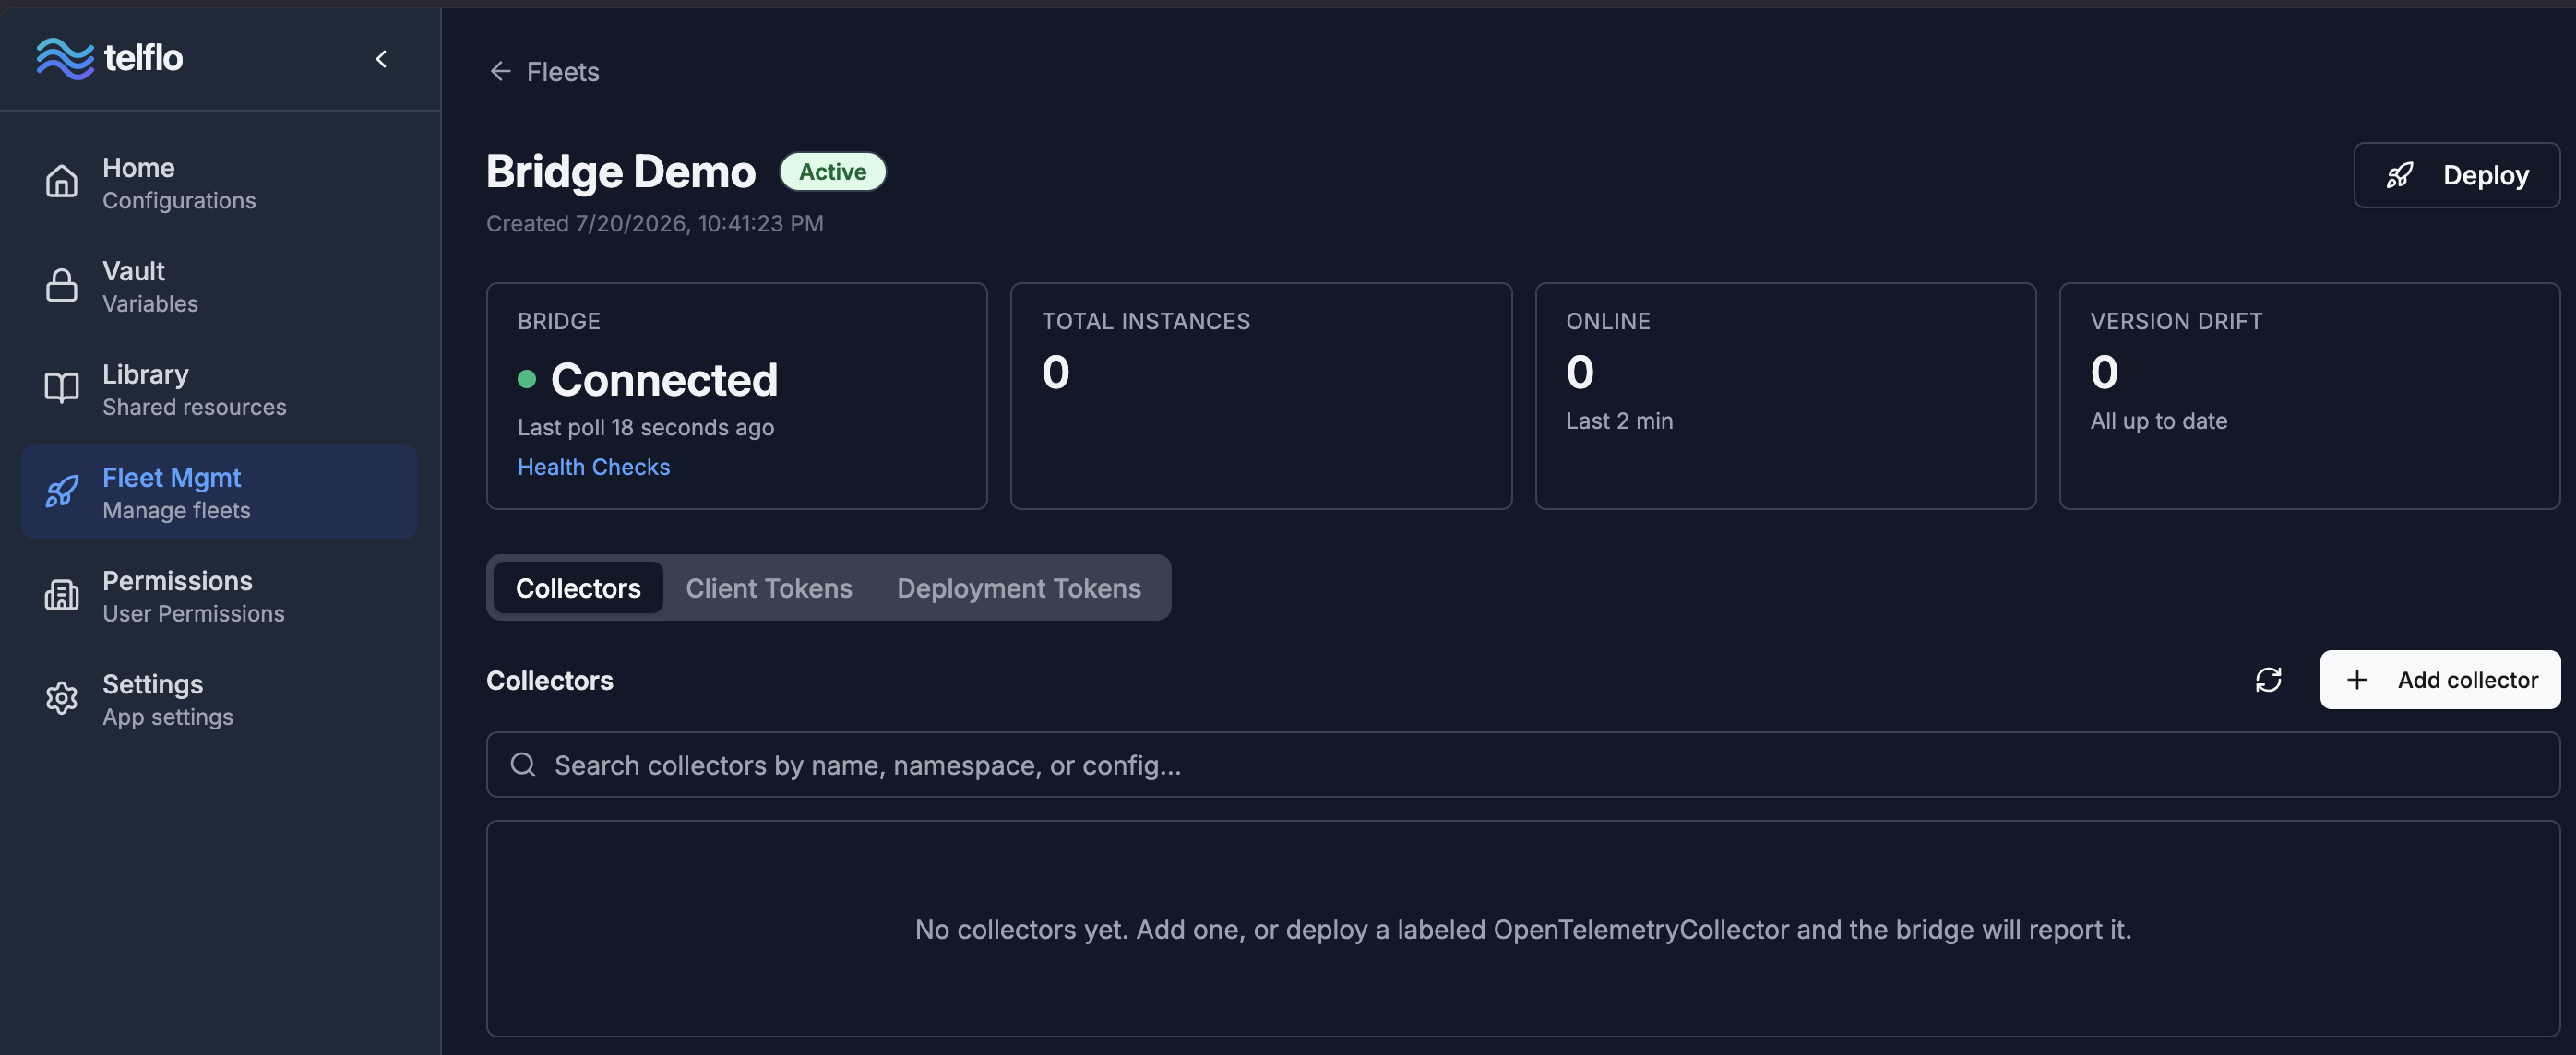
That's very cool because it shows that your bridge is wired into your cluster and is connecting back to telflo awaiting CRs to manage. Well, let's give it one!
- Click Ok.
Step 7: Deploy the collector
-
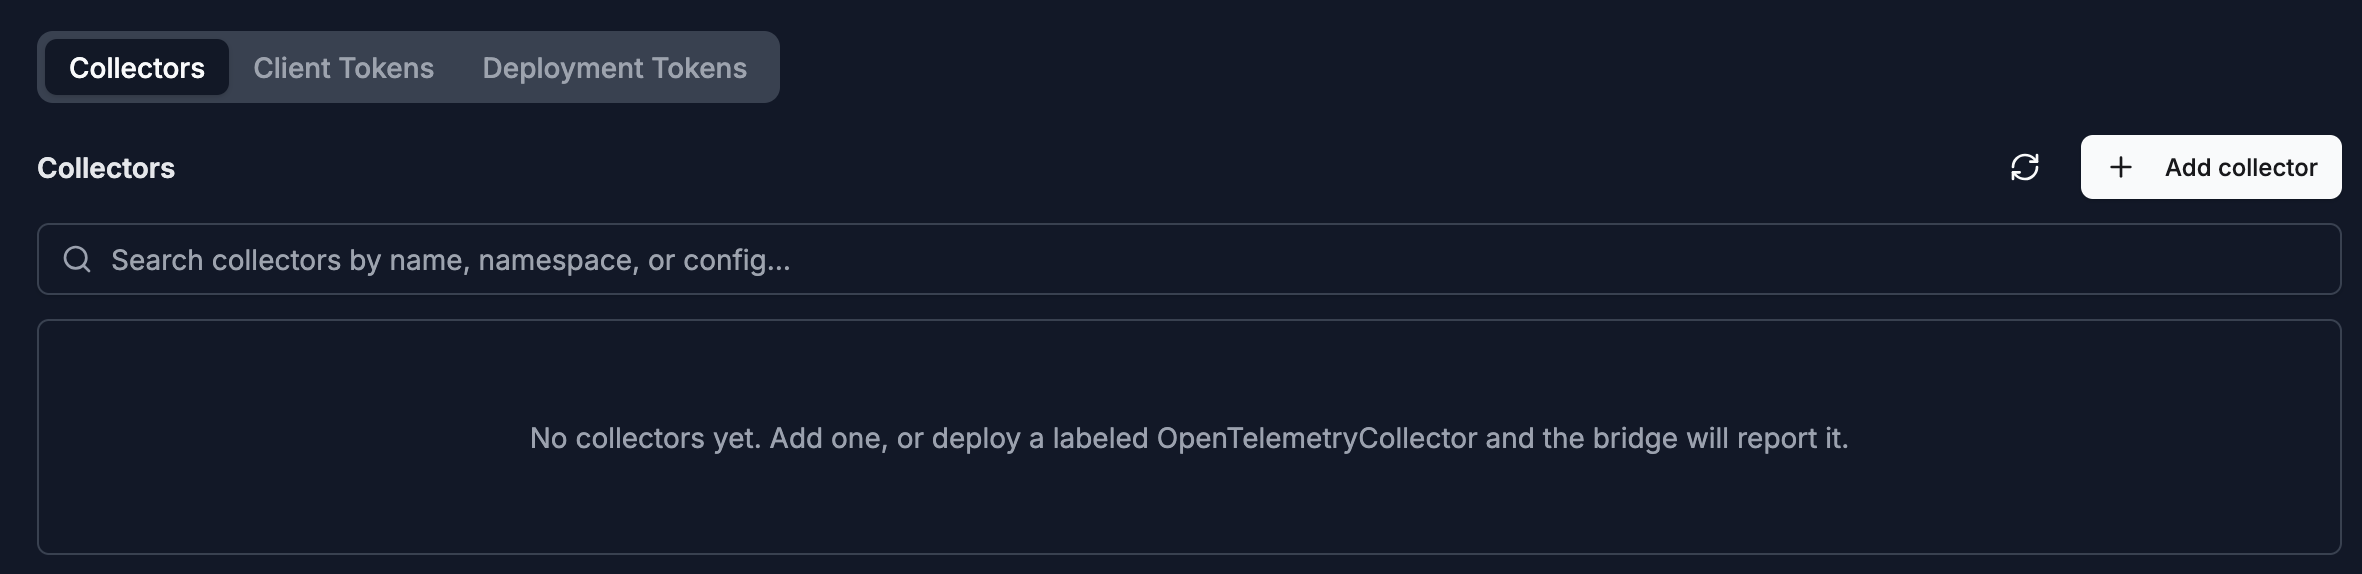
We're almost there! Find the "+ Add Collector" button on the right side of the Collectors group and click it.
-
The "Add Collector" dialog will open and here's where we need that namespace and collector name that the FQDN is formed from. Why? Because that's the address that the instrumented applications (in this case our test fixtures) will send data to. Our test fixtures are pre-configured to send data to http://telflo-gateway-collector.ns-col.svc.cluster.local:4318 and remember that the FQDN is formed as http://[collector-name]-collector.[namespace].svc.cluster.local:4318. So we must set our collector name to "telflo-gateway" and the namespace as ns-col. By doing this the traffic from the test fixtures will route to our collector pods. If you have instrumented your applications to send to http://acme-test-collector.acme-ns.svc.cluster.local:4318 then you would name your collector "acme-test" and your namespace would be "acme-ns".
Note: You might be wondering why the "-collector" in the URL exists. The -collector suffix comes from the OpenTelemetry Operator's naming convention and since we're using the OpenTelemetry Operator, we need to conform to this convention.
-
There's one problem. We're going to define the collector with namespace "ns-col", but that namespace has not been defined in the cluster. In the ssh window to your VM, run the following command to add the "ns-col" namespace to the cluster. This step would likely be unnecessary in your real deployments because the namespace would be defined, but for the demo we must add it.
kubectl create namespace ns-colNow set the namespace as "ns-col" and the name as "telflo-gateway". Choose the configuration as the Demo Bridge Configuration, and the version as "V1" (the version we published in the editor). Choose the "Deployment" option since we're deploying this as a CR deployment and not a DaemonSet.
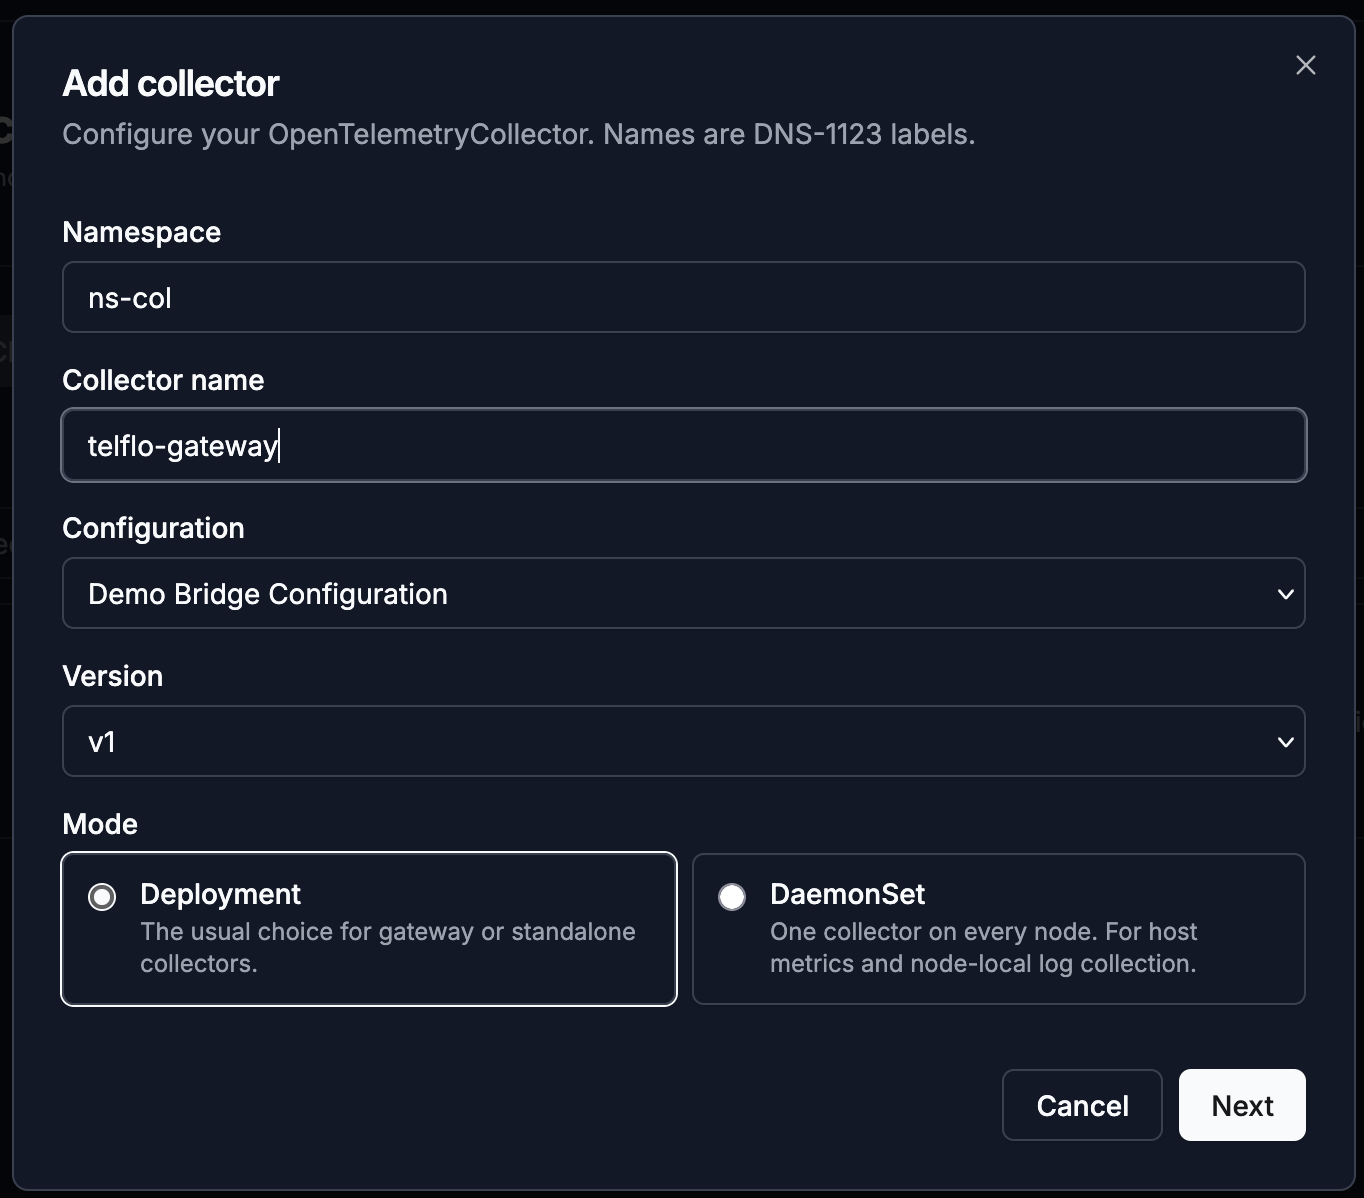
Click "Next" and you can see a preview of the exact CR that will be deployed.
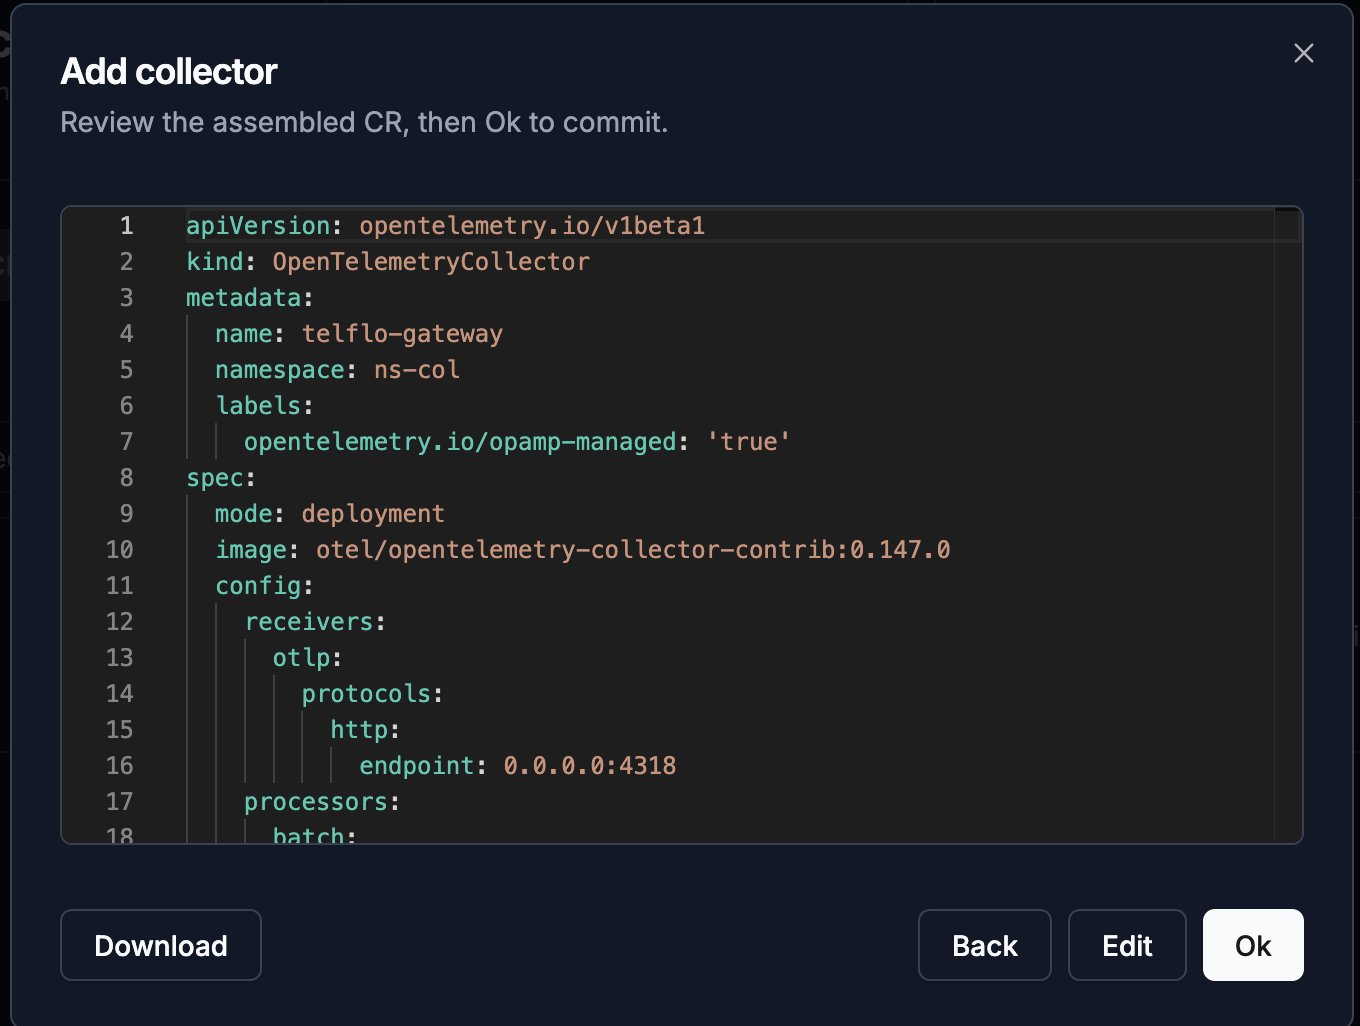
You can click the Edit button to edit the CR manually, but for now let's just click Ok. The collector will be deployed, and you should soon see all of the indicators go green indicating that the deploy was successful.
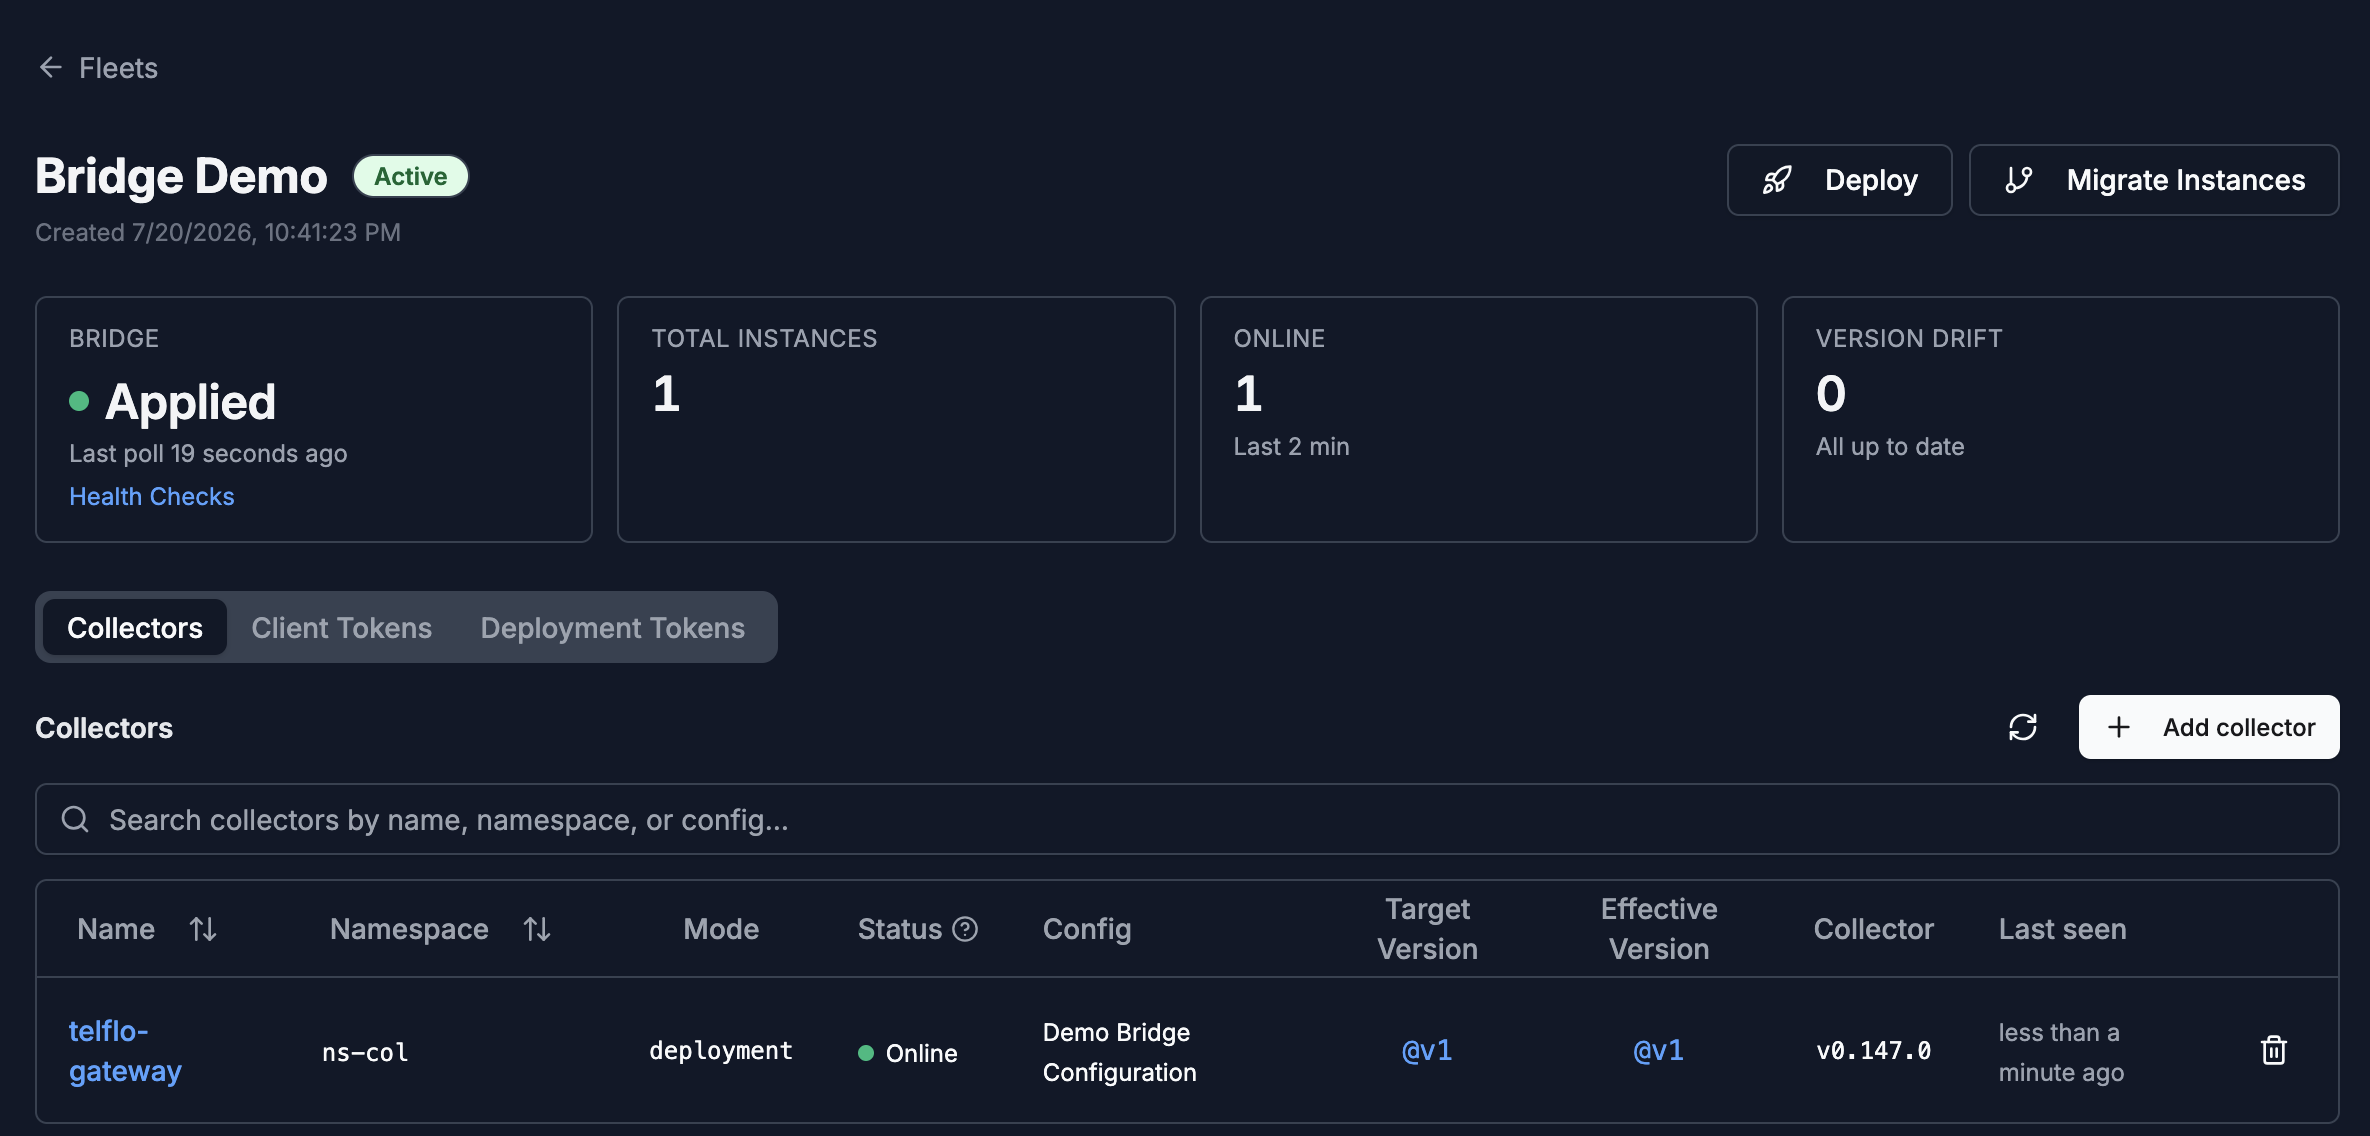
On the Collectors tab, the collector shows Online once the bridge confirms it. The Bridge state shows Applied once the configuration change has been applied. If something looks off, Monitor a Kubernetes fleet explains each bridge and collector state.
Step 8: Verify connectivity
Now return to your browser and refresh Grafana. You should see logs indicating success!
Now you can modify your configuration, deploy the changes, and see the changes reflected in your logs within minutes. We'll cover all of this in future Learnings, but don't be afraid to try on your own. It's a great safe way to learn, and discover the power of telflo fleet management!
Last updated on