

Collecting Linux logs with OpenTelemetry Collectors
A walkthrough configuring a fleet of OpenTelemetry collectors gathering logs on a server and sending them to an observability platform.
Managing OpenTelemetry collectors using an OpAMP client/server solution seems a bit daunting at first. The big box observability platforms have OpAMP solutions that are confusing, and adopting them feels like you're joining a large expensive platform that is beyond the scope of your needs; implementing an OpAMP server yourself, however, seems unnecessarily complex. So what's an SRE to do? Well, fortunately telflo sits right in that sweet spot between the two and today we'll walk through a simple implementation that shows how easy it can be to manage your collectors in telflo. Let's start by understanding the demo setup.
Before you begin
To follow along you'll need
- A computer with virtualization software. We'll create 2 Ubuntu VMs for this demo.
- A Telflo account. Sign in at telflo.com.
Initial Architecture
In the first part of this tutorial we're going to configure two VMs: one will be an observability platform that will receive and store log data using Loki, and report it using Grafana. The other VM will simulate an application producing real-time logs that you want to send to an observability platform (guess which one). Visually, the setup resembles this.
Each of my VMs is a "Ubuntu 24.04.3 Server (minimum)" instance deployed using Parallels. Of course the virtualization software shouldn't matter, but should any discrepancies arise you know what these instructions are based on. I also named my machines "observability-dev" and "log-generator-dev", and I'll refer to them that way. I'm not trying to tell you how to live your life, but it might make things easier if you did the same. Lastly, you'll notice the "-dev" suffixes. That's because an upcoming blog will demonstrate the awesome power (I'm not joking) of parameterizing the YAML and we'll need to distinguish between the VMs. Ok, onward and upward!
Step 1: Create the Observability Platform
Let's get the observability platform set up!
-
Create the first Ubuntu VM and name it observability-dev. Then SSH into the machine (copy/paste commands work better in my SSH terminal rather than the root terminal).
-
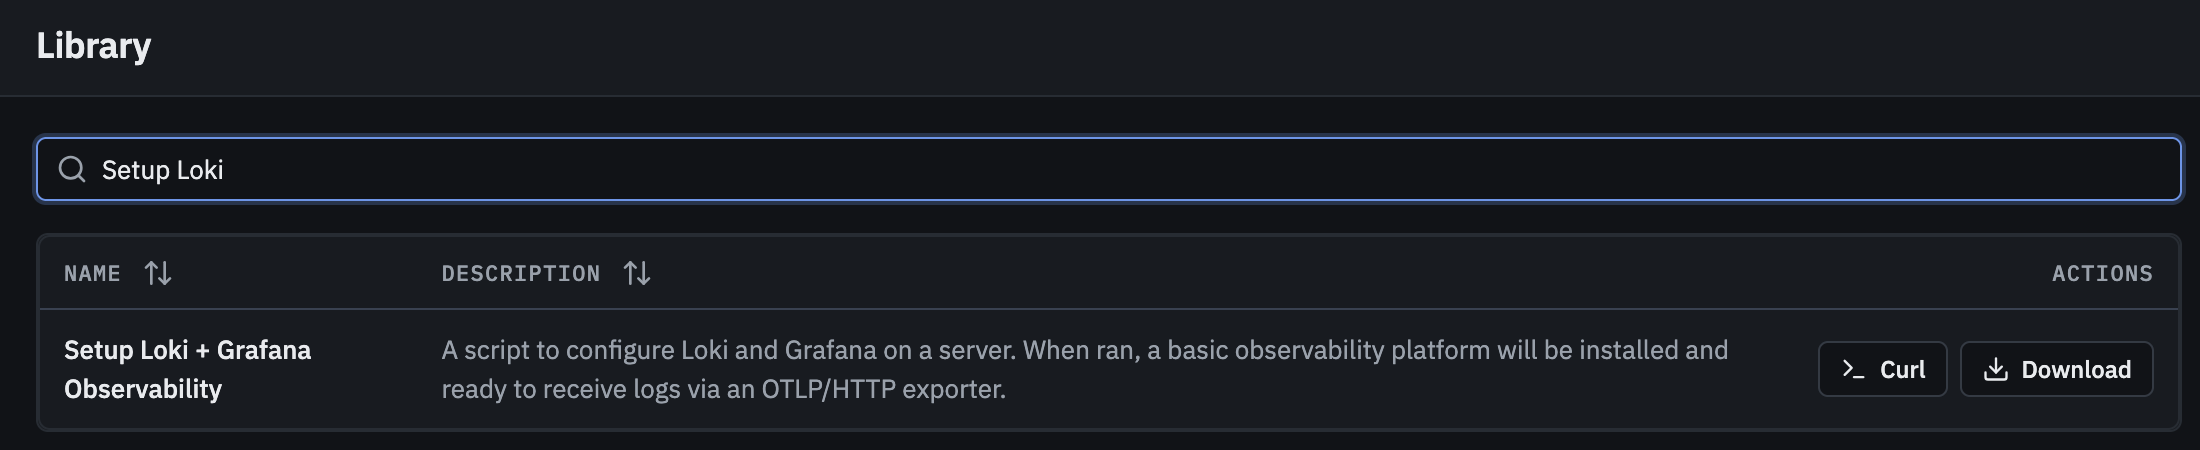
Now log in to telflo, click the "Learning" button in the left menu bar, and type "Setup Loki" in the filter. This should reveal a "Setup Loki + Grafana Observability" option. Click the ">_ Curl" button to copy a Curl command to your clipboard.
-
Return to the observability-dev ssh, paste the command and press enter. The "setup-observability-server.sh" script is downloaded. Run it with the command
sudo chmod +x setup-observability-server.sh && sudo ./setup-observability-server.shThat's it! When the script is finished you have a Loki instance awaiting OTLP/HTTP log data and a Grafana instance ready to report it. Of course the server doesn't have a browser so let's set up port forwarding on the host machine so that we can view Grafana on it.
-
Open a new terminal on your host machine and run the following
ssh -L 3001:localhost:3000 login_name@<IP of observability-dev>For example, my login was "jason" and the ip of my machine was 10.211.55.73, and so my command looks like
ssh -L 3001:localhost:3000 [email protected]
Now open a browser and navigate to http://localhost:3001/; the Grafana landing page should appear. At the login, input the default username/password as admin/admin and press enter. Enter a new password and continue. You'll be presented with the Grafana interface.
While this demo runs your observability platform locally, you could have just as well set up a cloud instance of Grafana, DataDog, Sematext...it doesn't matter. In the end you've got an observability platform listening for data and in this instance it's inexpensive, easy, and a great way to learn. Now that you can see the Grafana UI, go ahead and click "Drilldown" -> "Logs" in the left navbar. You should see no logs (as expected) since all we've done is set up a listener. We haven't generated any log data yet...yet...let's do that now.
Step 2: Set Up the Logging Test Fixtures
Next we'll set up a test fixture to generate realistic logging data, and save the logs to a file just like an application would. The logs will be stored at "/var/log/starfeuds/cantina.log" (make note of this path, we'll need it in a few), and will capture the evening exploits of StarFeuds troopers enjoying a night on the town. The simulation will include sensitive data such as credit card numbers (fake) and PII data (all made up), giving us a nice playground to learn about OpenTelemetry processors in the future. Let's go!
-
Create your second Ubuntu VM and name it "log-generator-dev". SSH into the machine.
-
Return to telflo, and type "log generator" in the learning page filter to reveal the "StarFeuds - Log Generator for Server" option. Click the ">_ Curl" button to copy a Curl command to your clipboard.
-
Return to your "log-generator-dev" ssh, paste the command and hit enter. This will download a file named "log-generator.tar.gz". Run the following command to extract it.
tar -xvf log-generator.tar.gz && cd log-generatorLogging is now underway. You can see it by running a tail command on that file we noted earlier.
tail -f /var/log/starfeuds/cantina.logNote: This configures a systemd service called starfeuds-generator.service which will restart on reboot. For completeness, here are the commands to stop and remove the service
# Stop the service immediately (will restart on reboot)
sudo systemctl stop starfeuds-generator
# Disable the service to prevent it from starting again on boot sudo systemctl disable starfeuds-generatorOk, now we have the observability platform listening for data, and the generator generating data. If you were to refresh your Grafana instance there would still be no logs displayed. That's because we still need to connect the two, and here's where the magic of the OpenTelemetry collector and telflo come in. We can use the collector to grab those logs off of disk and send them to Loki. Once Loki has saved them to its database, Grafana can query it, and render the logs. But first we have to create a pipeline that defines the behavior of a collector.
Step 3: Set Up the Collector Configuration
The collector configuration is a YAML file that defines the collector's behavior, which we need to do in order to tell it "grab this data from here and send it over there". Keep in mind that the collector has a LOT of processing capabilities which allow you to curate the data as it flows through a "pipeline" of transformations, but for this demo we'll keep it simple: Grab the data off of the disk and send it to Loki. Let's define the configuration.
-
In telflo, click the "Configurations" option in the left menu bar, then click the "New configuration" button. Choose "Blank configuration", name the configuration "starfeuds logging" and click "Create". This will create your pipeline and automatically navigate to it in the pipeline editor.
Delete the Traces and Metrics pipelines by clicking on them, and then pressing your Delete button. All that should remain is the "Logs" pipeline.
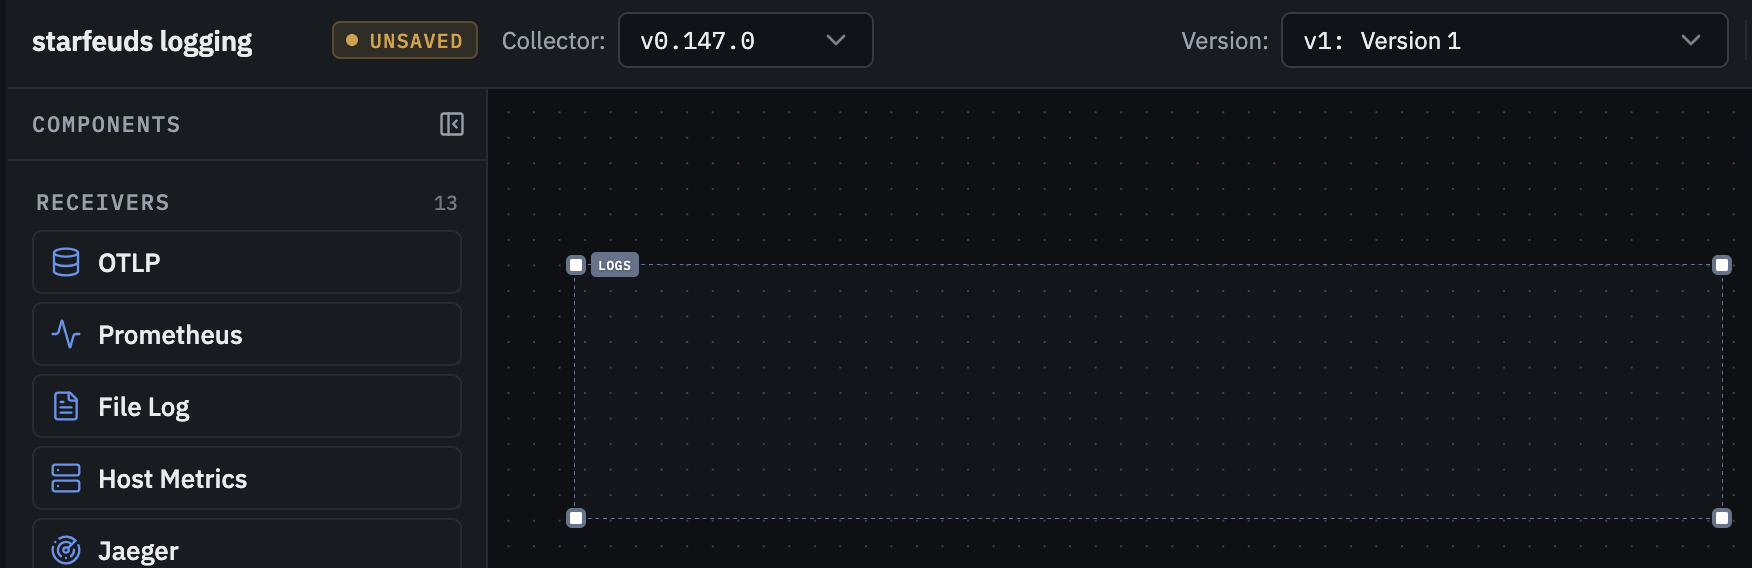
-
In the left "Components" list, you'll find many of the most commonly used pipeline components. In our case, we want to pull logs off of disk and into the receiver, so in the Receivers section find the "File Log" option and drag an instance into the editor. In the "Include Paths" section of the properties editor paste "/var/log/starfeuds/cantina.log", the path where the test fixture is writing and the source of the Filelog receiver data. Notice the "+ Add Path" button. You could add additional paths, but for now this path is sufficient.
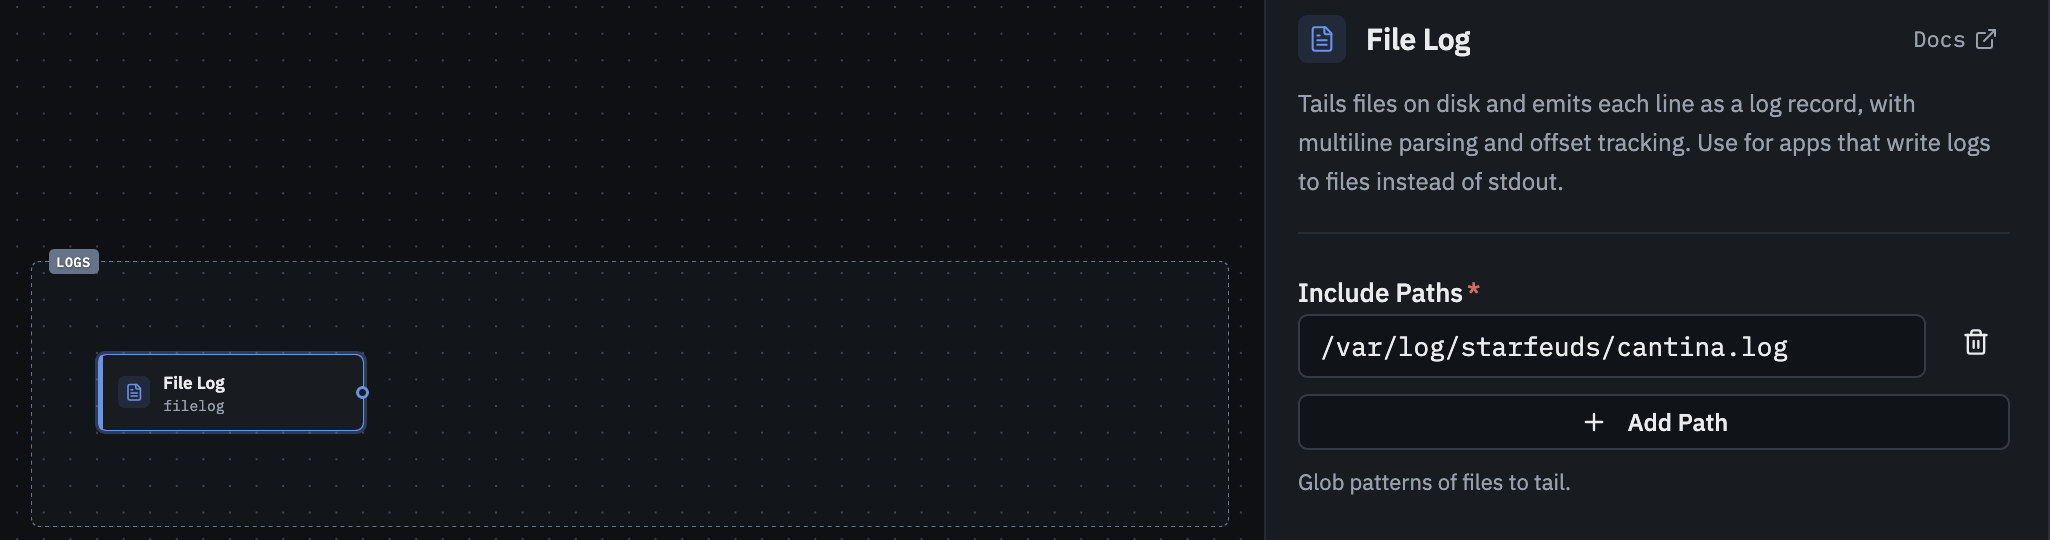
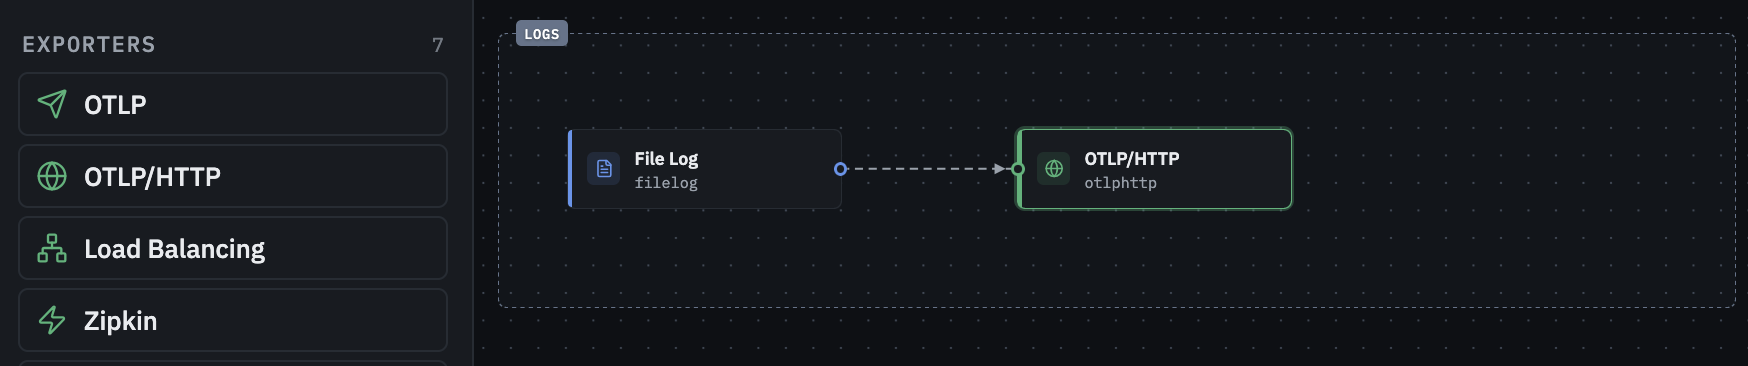
Ok, now you've wired up your receiver, we need to wire up the exporter to push the received data to the observability platform. In future learnings, we'll learn about the processors that you can inject in the pipeline to transform your data, but for now let's just export the raw data. In the "Exporters" section of the components (on the left side of the editor canvas), find the "OTLP/HTTP" exporter. Drag an instance into the "Logs" section, and connect the two components by clicking on the connector in the Filelog component, and dragging onto the OTLP/HTTP exporter.
-
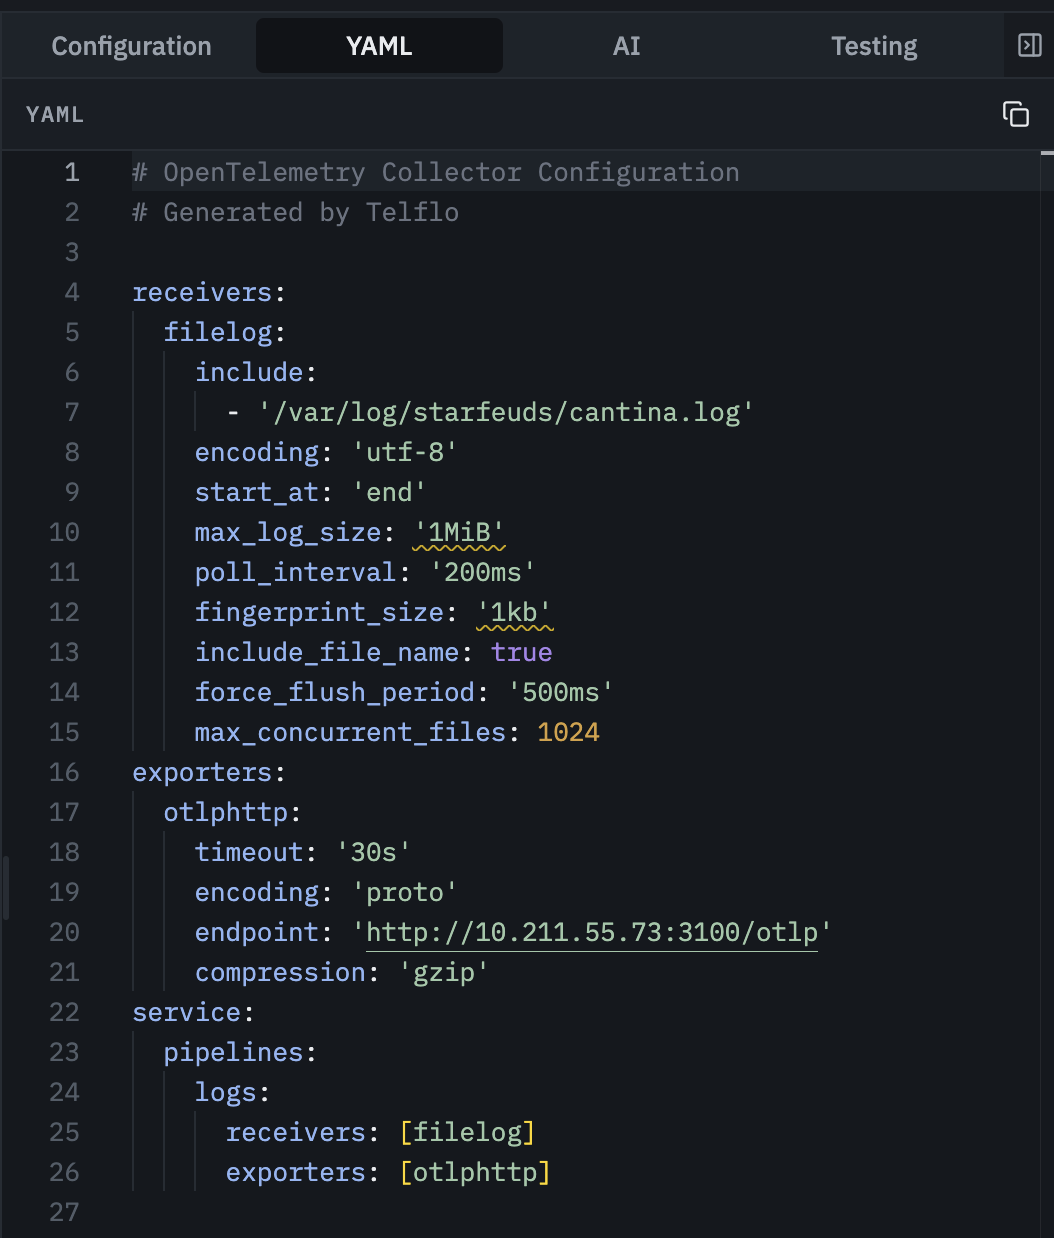
Click on the OTLP/HTTP exporter component and set the endpoint as your Loki listening endpoint on your observability-dev server (the ip:port that your other VM is listening for log traffic at). This will be "http://<IP of observability-dev>:3100/otlp". For example, for me this was http://10.211.55.73:3100/otlp

Note: You could also edit the YAML directly. In the tabbed panels on the right side of the screen, click the "YAML" tab to open the YAML editor. All edits sync between the visual components and the YAML tab, so you could edit directly but since we used the visual editor everything is up to date, but just to be sure it should look something like this.
Step 4: Publish the Pipeline
And now that we have our pipeline defined, how do we get it onto log-generator-dev so that it starts pushing those logs over to our observability platform? We start by publishing the pipeline to the organization. This creates a snapshot of the pipeline at this point in time and makes it available for fleet deployment (pretty cool, I have to say). And it's super simple, just click the Publish button and confirm your choice (don't worry, we can create new versions to make changes if needed).

That's it, the pipeline is now defined and ready to be deployed. We're almost there.
Step 5: Deploy the Fleet
It's finally time to connect the dots here. At this point you should have 2 VMs (observability-dev and log-generator-dev) and 3 terminals (one to each of the VMs and a third forwarding port 3001 traffic to your observability platform). Now we deploy the collector.
Note, your port forwarding might disconnect occasionally, just re-run the command to re-establish the connection.
-
Return to telflo and click on the "Fleet" option on the left hand side. A fleet is a collection of machines that you want to manage as a unit, or as multiple units. In either case think of it as something you want grouped together such as "all my dev machines". In the Active Fleets page, click on the "New Fleet" button and, in the "Create a new fleet" dialog, choose "Linux servers & VMs". Give your fleet a name such as "My Dev Fleet", leave "Token expiry" at its default, and click the "Create fleet" button. You should see the new fleet defined.

-
Click on the fleet name (My Dev Fleet) to navigate to the fleet details. A new fleet shows a "Set up this fleet" checklist with "Assign" and "Install" shortcuts, and you'll notice a set of tabs:
- Collectors: These are the collectors that have "phoned home" to register with telflo for fleet management and pick up their assigned pipeline configurations.
- Deploy Groups: Each deploy group ties one published configuration to a set of collectors. You can have many deploy groups in a single fleet.
- Tokens: Here you can manage the "Fleet Tokens" your collectors authenticate with, and disable the "Install Links" (Quick Deploy links) when you're done with them.
We need to start in the "Deploy Groups" tab, go ahead and click on it.
When we created the fleet, a "Default" deploy group was created, but not configured; we need to set that up. Click the "Assign" button to open the "Assign a configuration to Default" dialog. Select the "starfeuds logging" configuration and @v1 for the version (only published configurations are available here). This links the configuration version we set up in Step 3 with this deploy group so that when a collector phones home we respond with "Hey, this is the configuration you should be running. Now have a nice day!" Leave "Assigned variable group" as "None (org defaults only)". Below it the dialog folds the configuration's Read/write paths (one entry here, "filelog reads /var/log/starfeuds.") and offers Installing with Docker? Add volume mounts. Both matter only when a collector runs in a container; this walkthrough installs the collector directly on the VM, so leave them as they are and click "Assign". See Volume mounts for the container case.
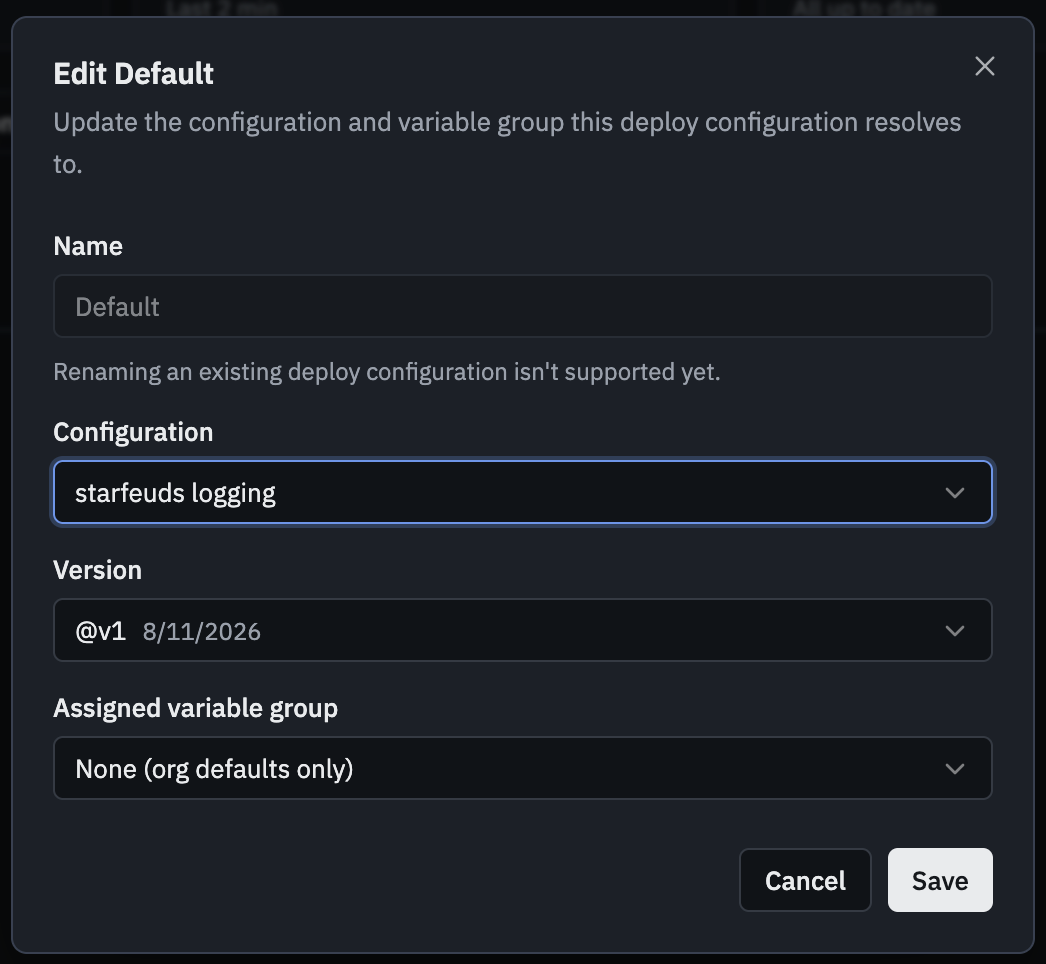
Congrats, you've now defined your deploy group and all that's left is to use it!
Click the "Install" button on the Default row to open the "Install collectors: Default" dialog. Change the "Platform" from the default "Container image (GHCR) — pull and run" to the "Server: All In One" entry that matches your chipset architecture and leave all other defaults (the "Install as a systemd service" option stays checked). Click "Quick Deploy". This will open the Quick Deploy instructions. The copied command contains your fleet's token and expires after 24 hours, so treat it as a secret.
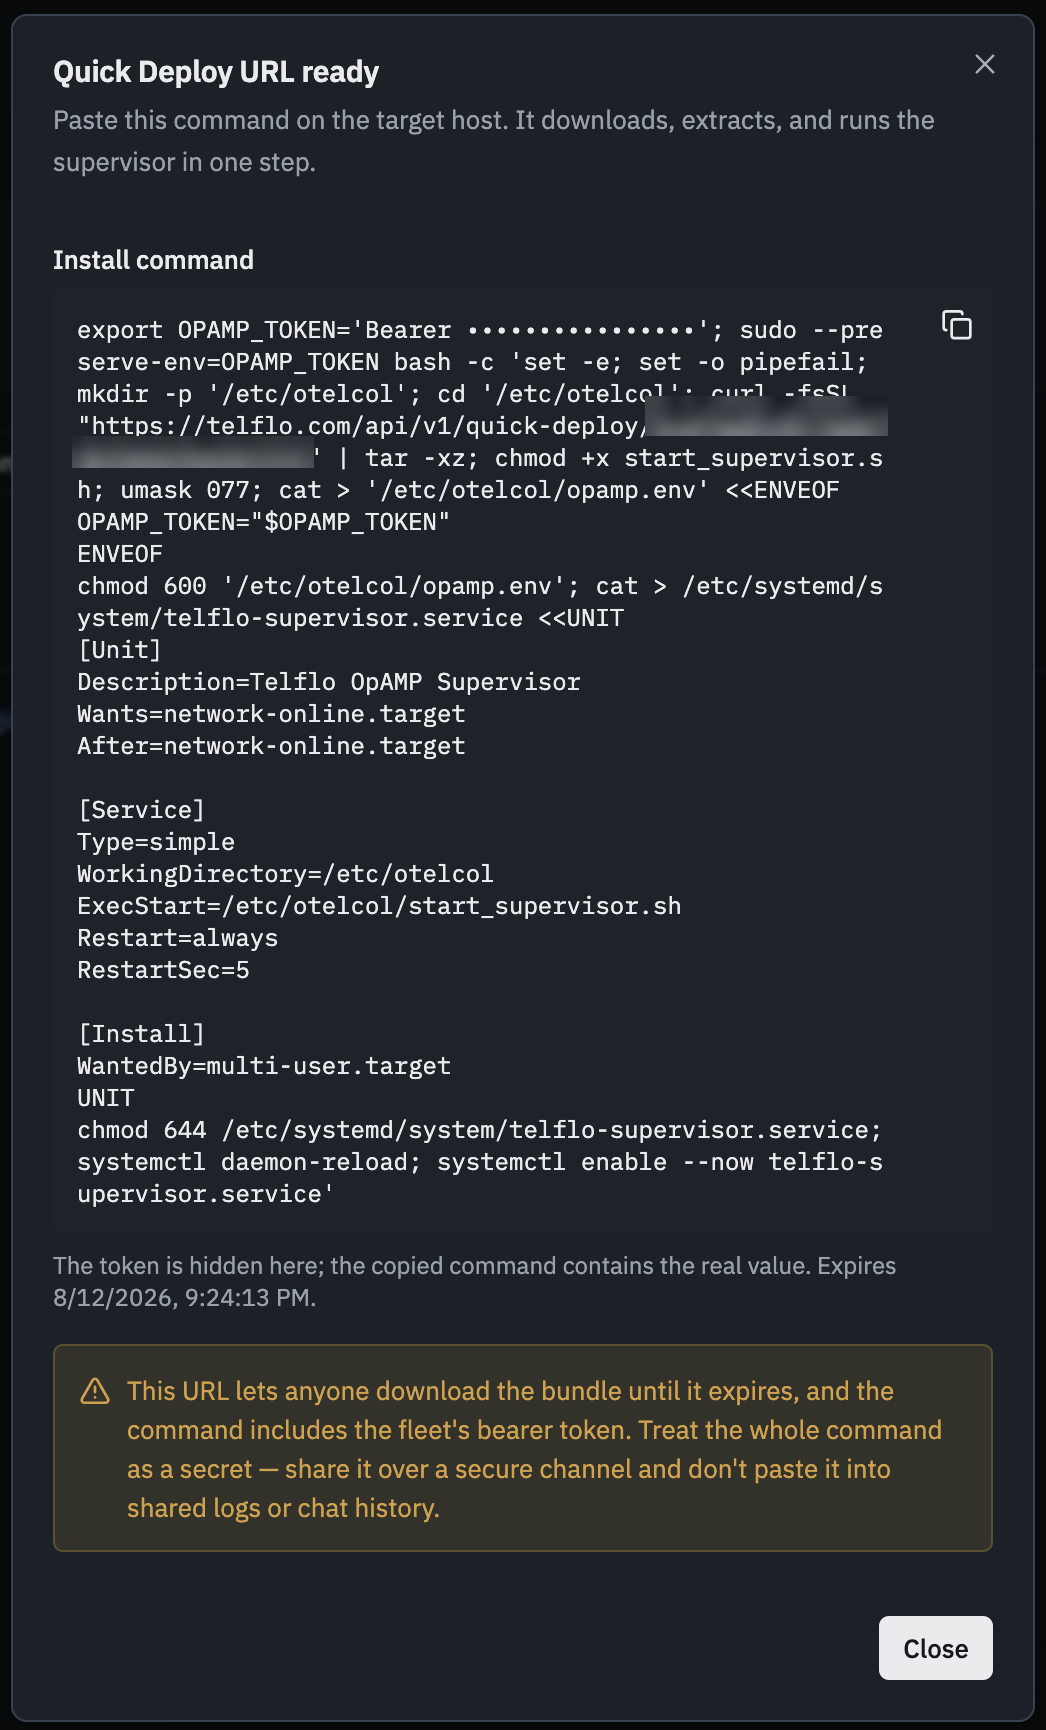
Click the Copy button next to the "Install Command" and return to the log-generator-dev ssh; paste the command and press enter.
Now quick! Return to the "Collectors" tab (it refreshes every 15 seconds) to see the new row appear with a status of "Applying."
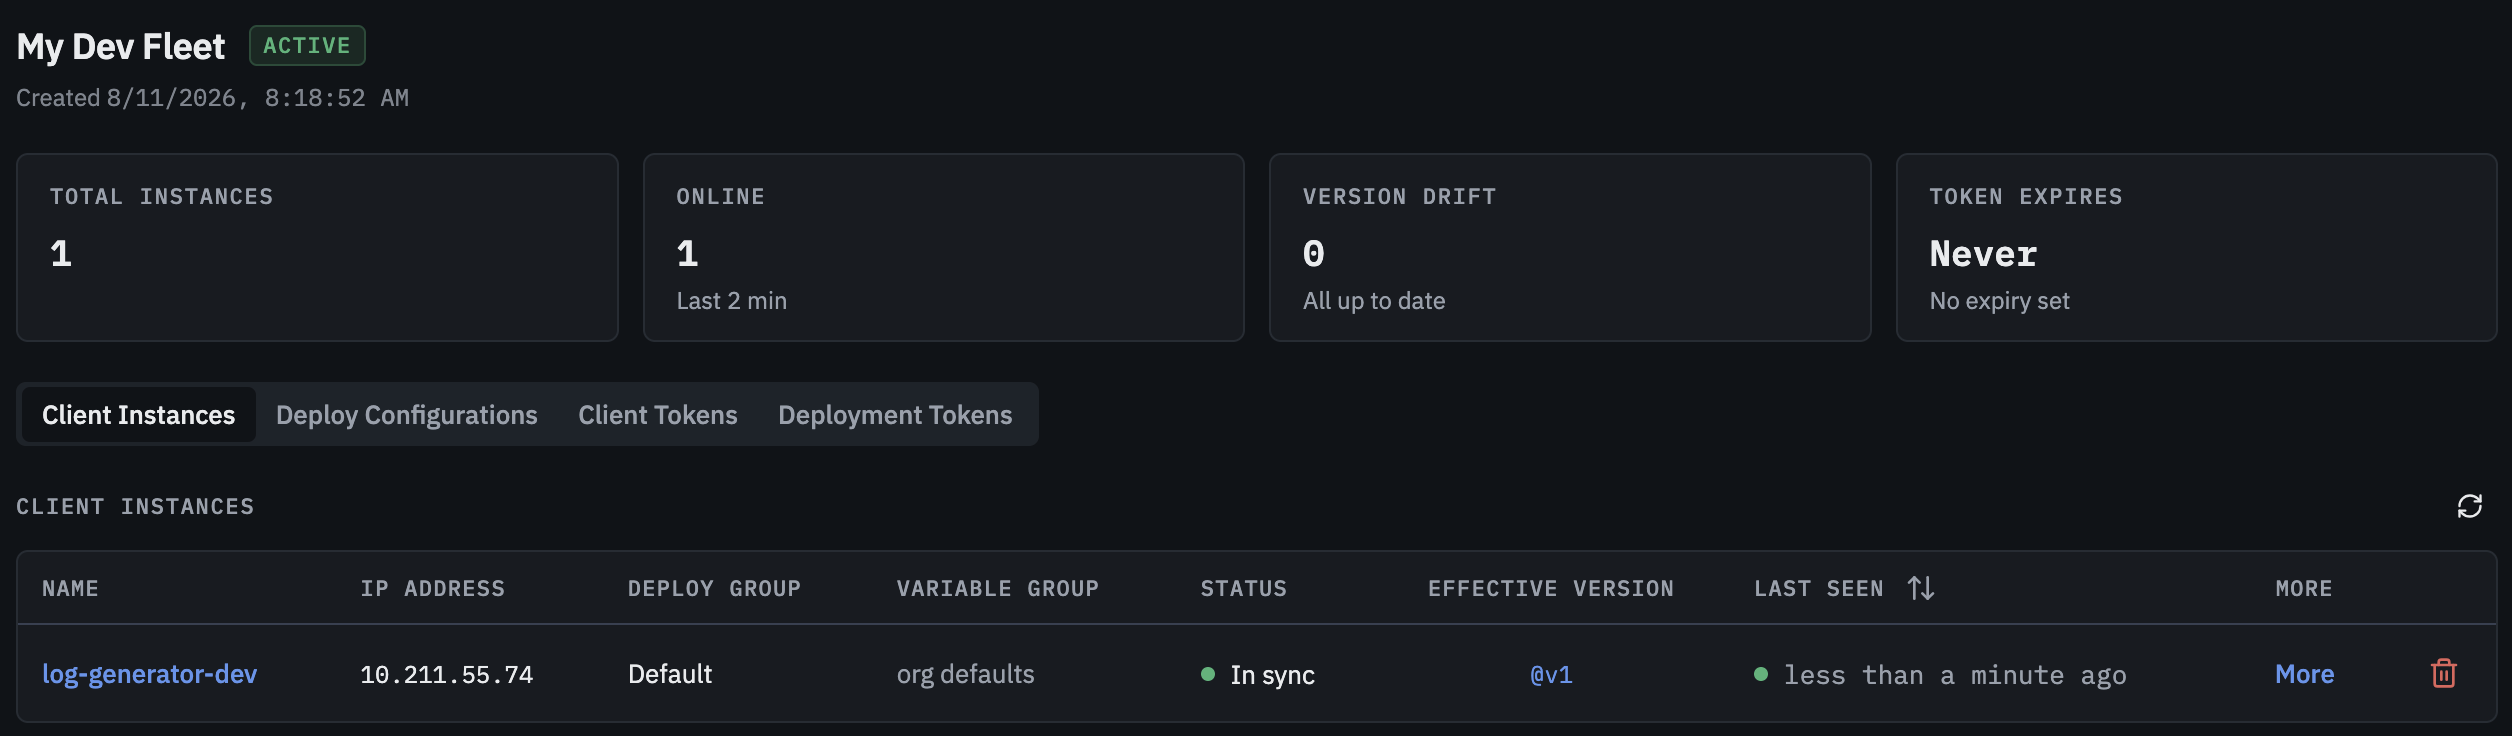
Ok, I missed it but after Applying (meaning that the assigned starfeuds-logging YAML was picked up by the collector), the Status should show as "In sync" with a green circle (see image above). That means your collector is running, has registered itself within your account in telflo, and is running your "starfeuds logging" configuration.
Return to your browser, the one with the empty Grafana, and refresh the logs view. Now you'll see your logs! That's it, you've pushed an application's log files into an observability platform. And while this demo may seem simple, it is a really big step in learning how to manage your fleet of OpenTelemetry deployments.
Note: As with the log generator, this configures a systemd service. A couple of useful commands are
# Stop the service immediately (will restart on reboot)
sudo systemctl stop telflo-supervisor.service
# Disable the service to prevent it from starting again on boot sudo systemctl disable --now telflo-supervisor.service
Optional: The same steps from the terminal
Steps 4 and 5 can also run from the Telflo CLI, the npm package telflo. After telflo login, run
telflo config list                                                  # copy the "starfeuds logging" configuration id
telflo config publish <configuration-id> --version 1
telflo fleet create --label "My Dev Fleet" --type server-supervisor
telflo deploy --fleet <fleet-id> --config <configuration-id> --name dev-hosts
telflo fleet install <fleet-id> --platform linux --deployment <deployment-id>
telflo deploy creates a new deploy group (here "dev-hosts") instead of filling in the fleet's "Default" group, and prints the deployment id to pass to fleet install. telflo fleet install ... --platform linux prints the same systemd install command as the "Server: All In One" platform, built for amd64 unless you pass --arch arm64; run it on log-generator-dev. The install URL in the command expires after 24 hours. See Commands.
Step 6: Celebrate
Look at what you've accomplished in almost no time. You've set up an observability server, you've deployed a test fixture generating logs of a raucous StarFeuds trooper's night out on the town, you've defined a pipeline, and you've deployed a small collector fleet that moved the data into your observability platform. And you can now see the results in Grafana. I don't know about you, but I think that deserves a cold frothy Bantha Brew. Hip Hip!
What's great about these kinds of environments is that you can easily test, tinker, and learn without fear of destroying things. So experiment and learn, read the telflo docs to learn how to modify and publish new versions of your Configuration to your fleet, and keep an eye out for upcoming learnings that can propel your OpenTelemetry skills to new levels.
Thanks, see you soon!
Last updated on